The structure of biological pathways represents our knowledge about the complex relationships between molecules (activation, inhibition, reaction, etc.). However, neither over-representation analysis or pathway enrichment analysis take the pathway structure into consideration when determining which pathways are more likely to be involved in the conditions under study.
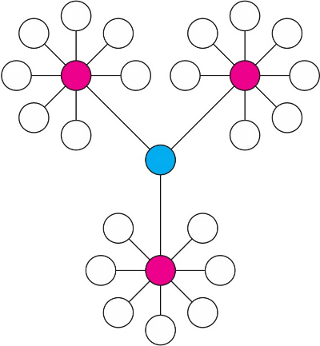
It is obvious that changes in the key positions of a network will trigger more severe impact on the pathway than changes on marginal or relatively isolated positions. As illustrated by the figure below - the red node (more connections) and blue node (bottleneck) are considered more important that terminal nodes. The program uses two well-established node centrality measures to estimate node importance - degree centrality which emphasize red nodes, and betweenness centrality which emphasizes blue node. See detailed discussion on degree and betweenness centrality.
Please note, for comparison among different pathways, the node importance values calculated from centrality measures are further normalized by the sum of the importance of the pathway. Therefore, the total/maximum importance of each pathway is 1; the importance measure of each metabolite node is actually the percentage w.r.t the total pathway importance, and the pathway impact is the cumulative percentage from the matched metabolite nodes.
