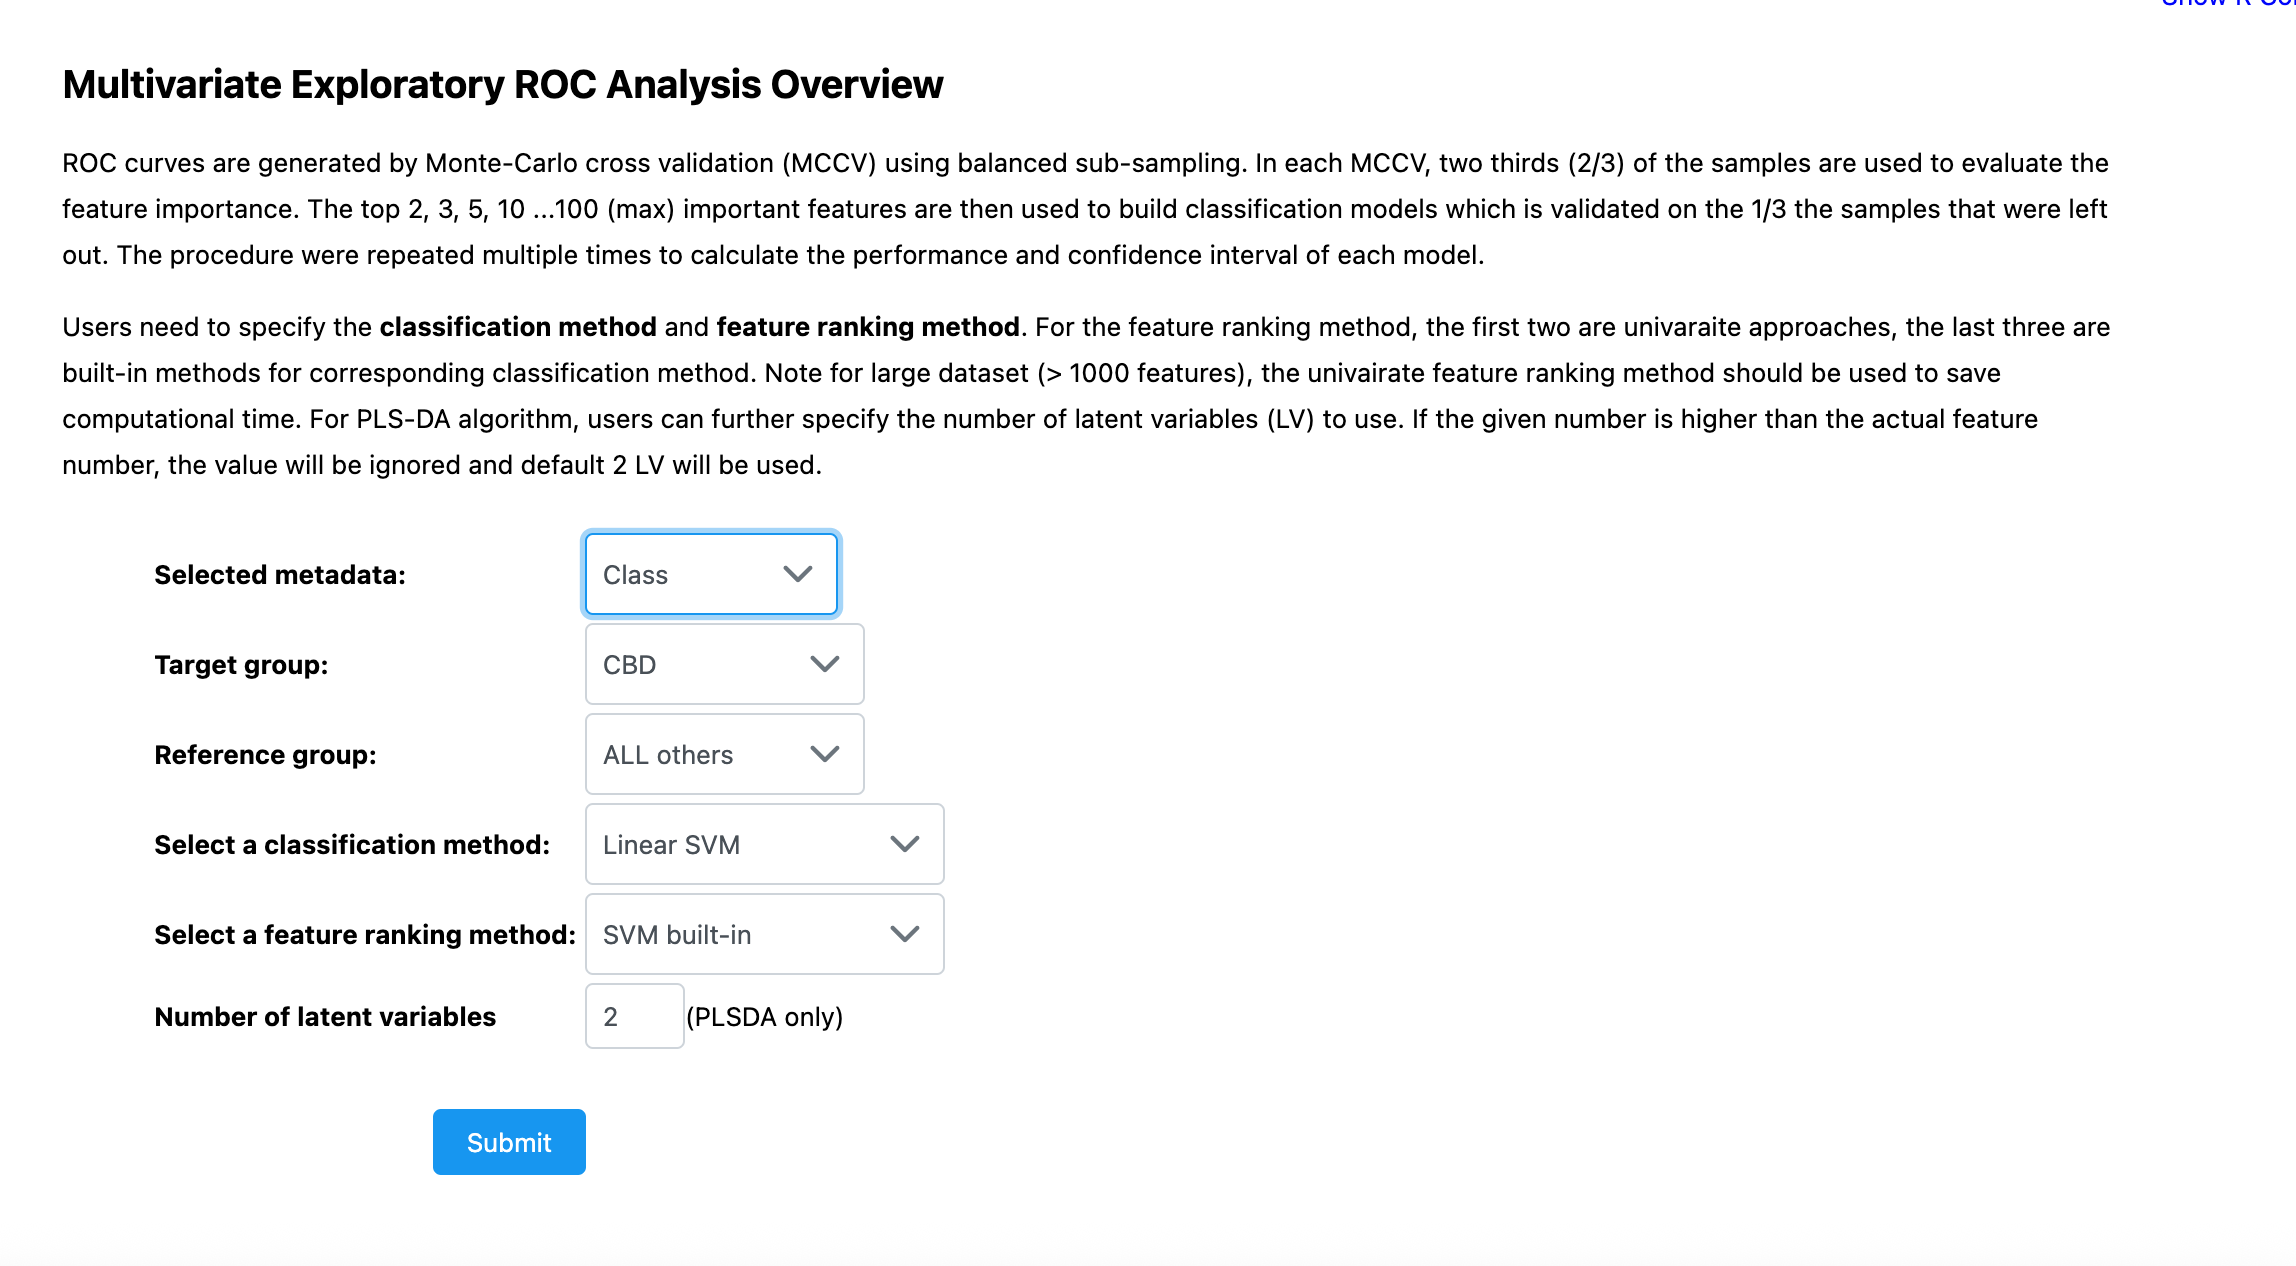
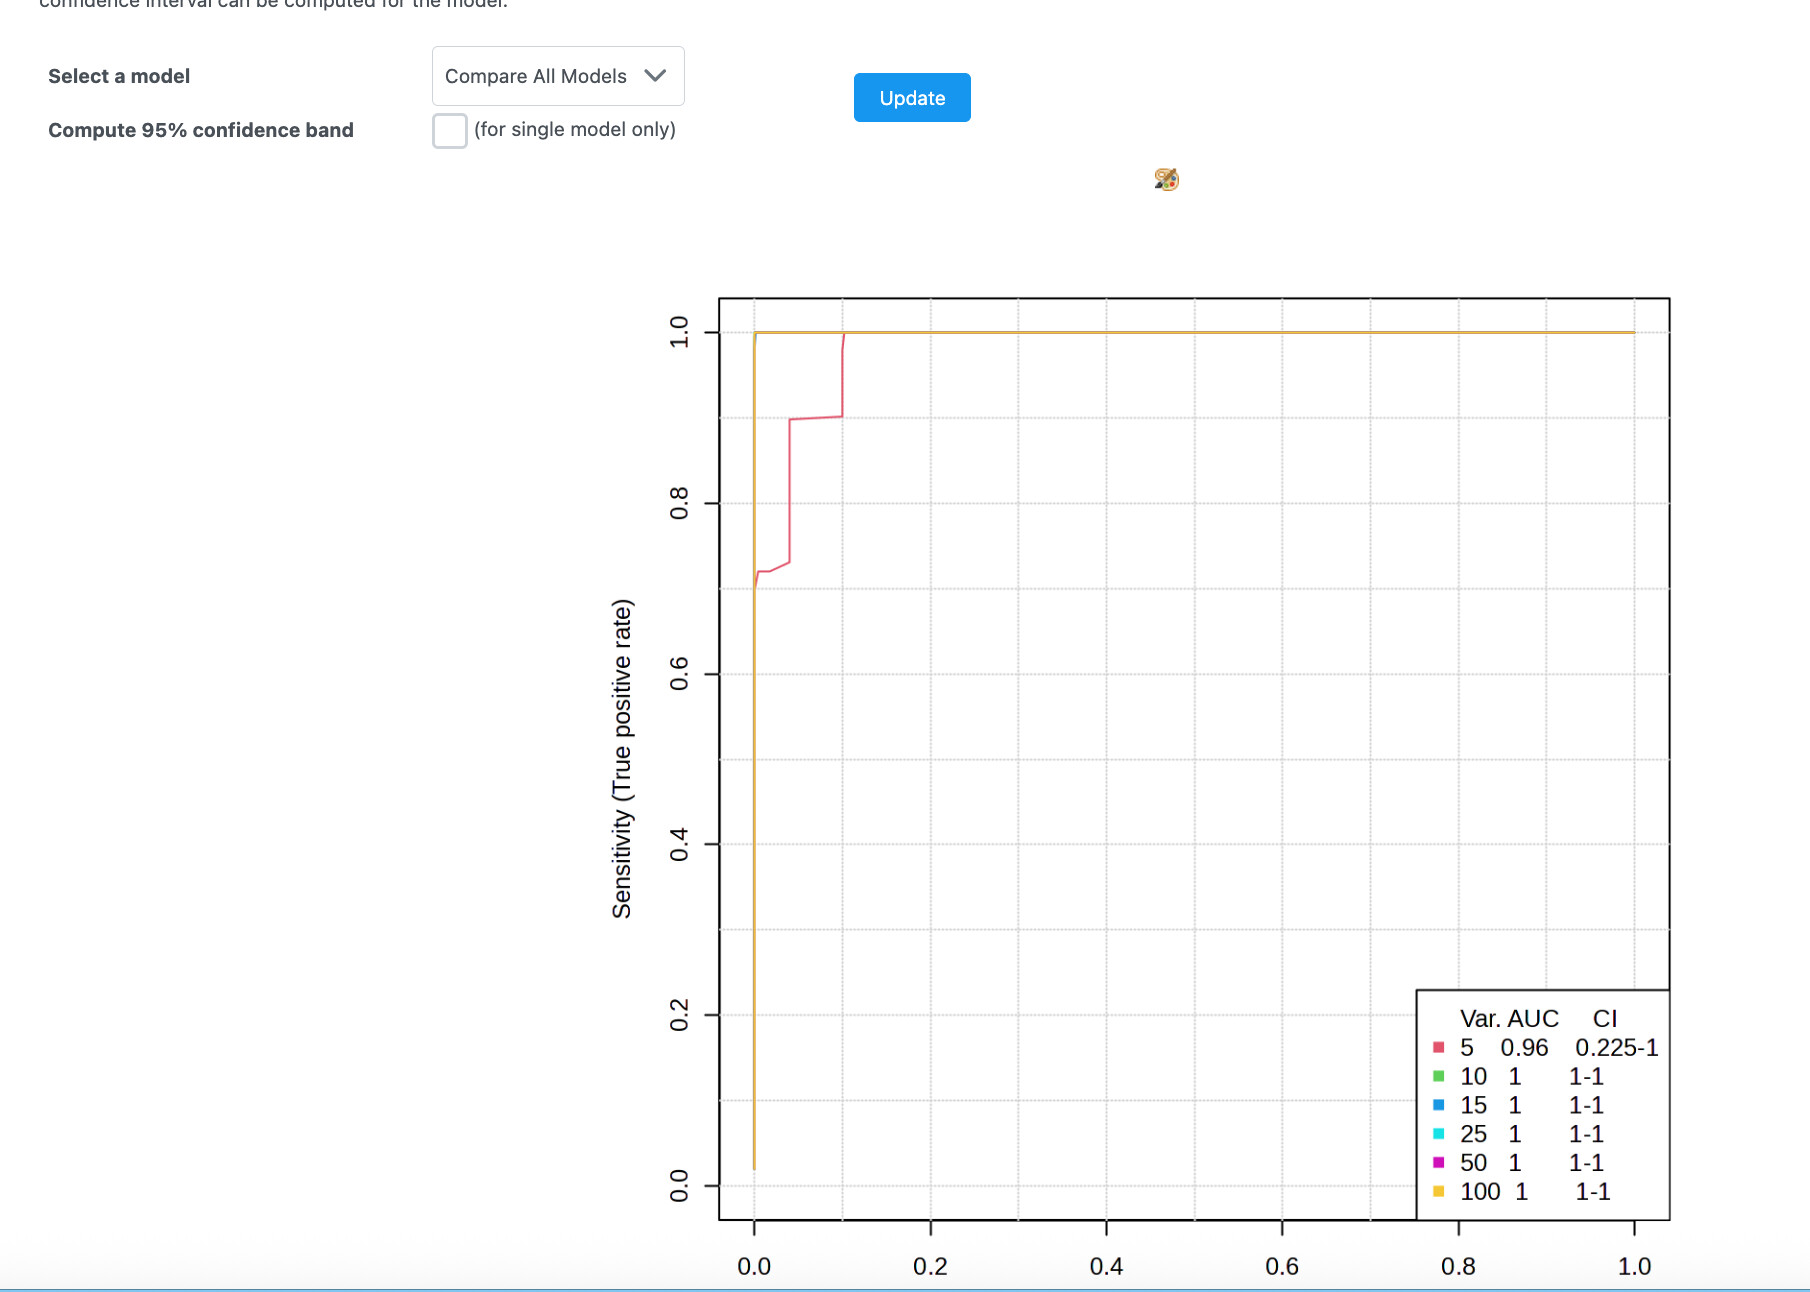
Hey this is an edit following the post guidelines. I’m using the Biomarker Analysis module in MetaboAnalyst to perform ROC curve analysis on 156 lipid species based on normalized peak intensity values from untargeted LC-MS data. When I run the analysis, the ROC plot shows nearly all AUCs as 1.0 and collapses into a single horizontal line at the top, which suggests perfect classification for almost every variable. However, when I check the “Univariate ROC” table, the AUC values clearly vary (e.g., 0.94, 0.87, 0.75), meaning the plot does not reflect this variability.
Is the ROC plot only showing the top 5 variables by default? If so, how can I adjust the settings to visualize ROC curves for all lipid features, or at least more than just the top 5?
Any suggestions to resolve this discrepancy between the AUC table and ROC plot would be greatly appreciated. I’m a student researcher working with lipidomic data for leukemia and this would help clarify my biomarker interpretation.
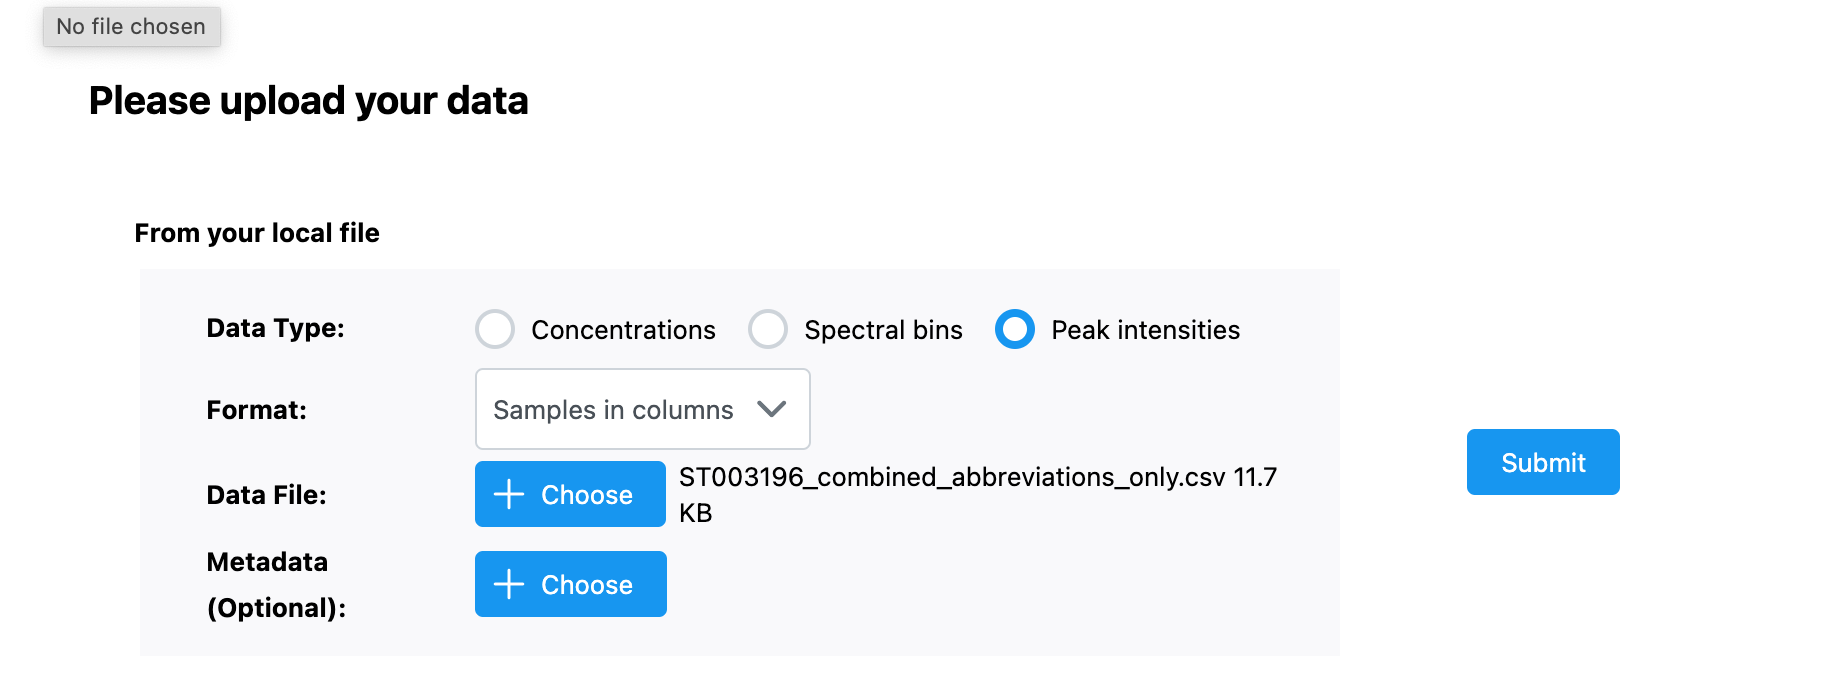
Tool and module: MetaboAnalyst 6.0 Biomarker Analysis Multivariate Exploratory ROC Analysis Result
Copy of data file: OmicsForumROCCurve.csv (11.7 KB)
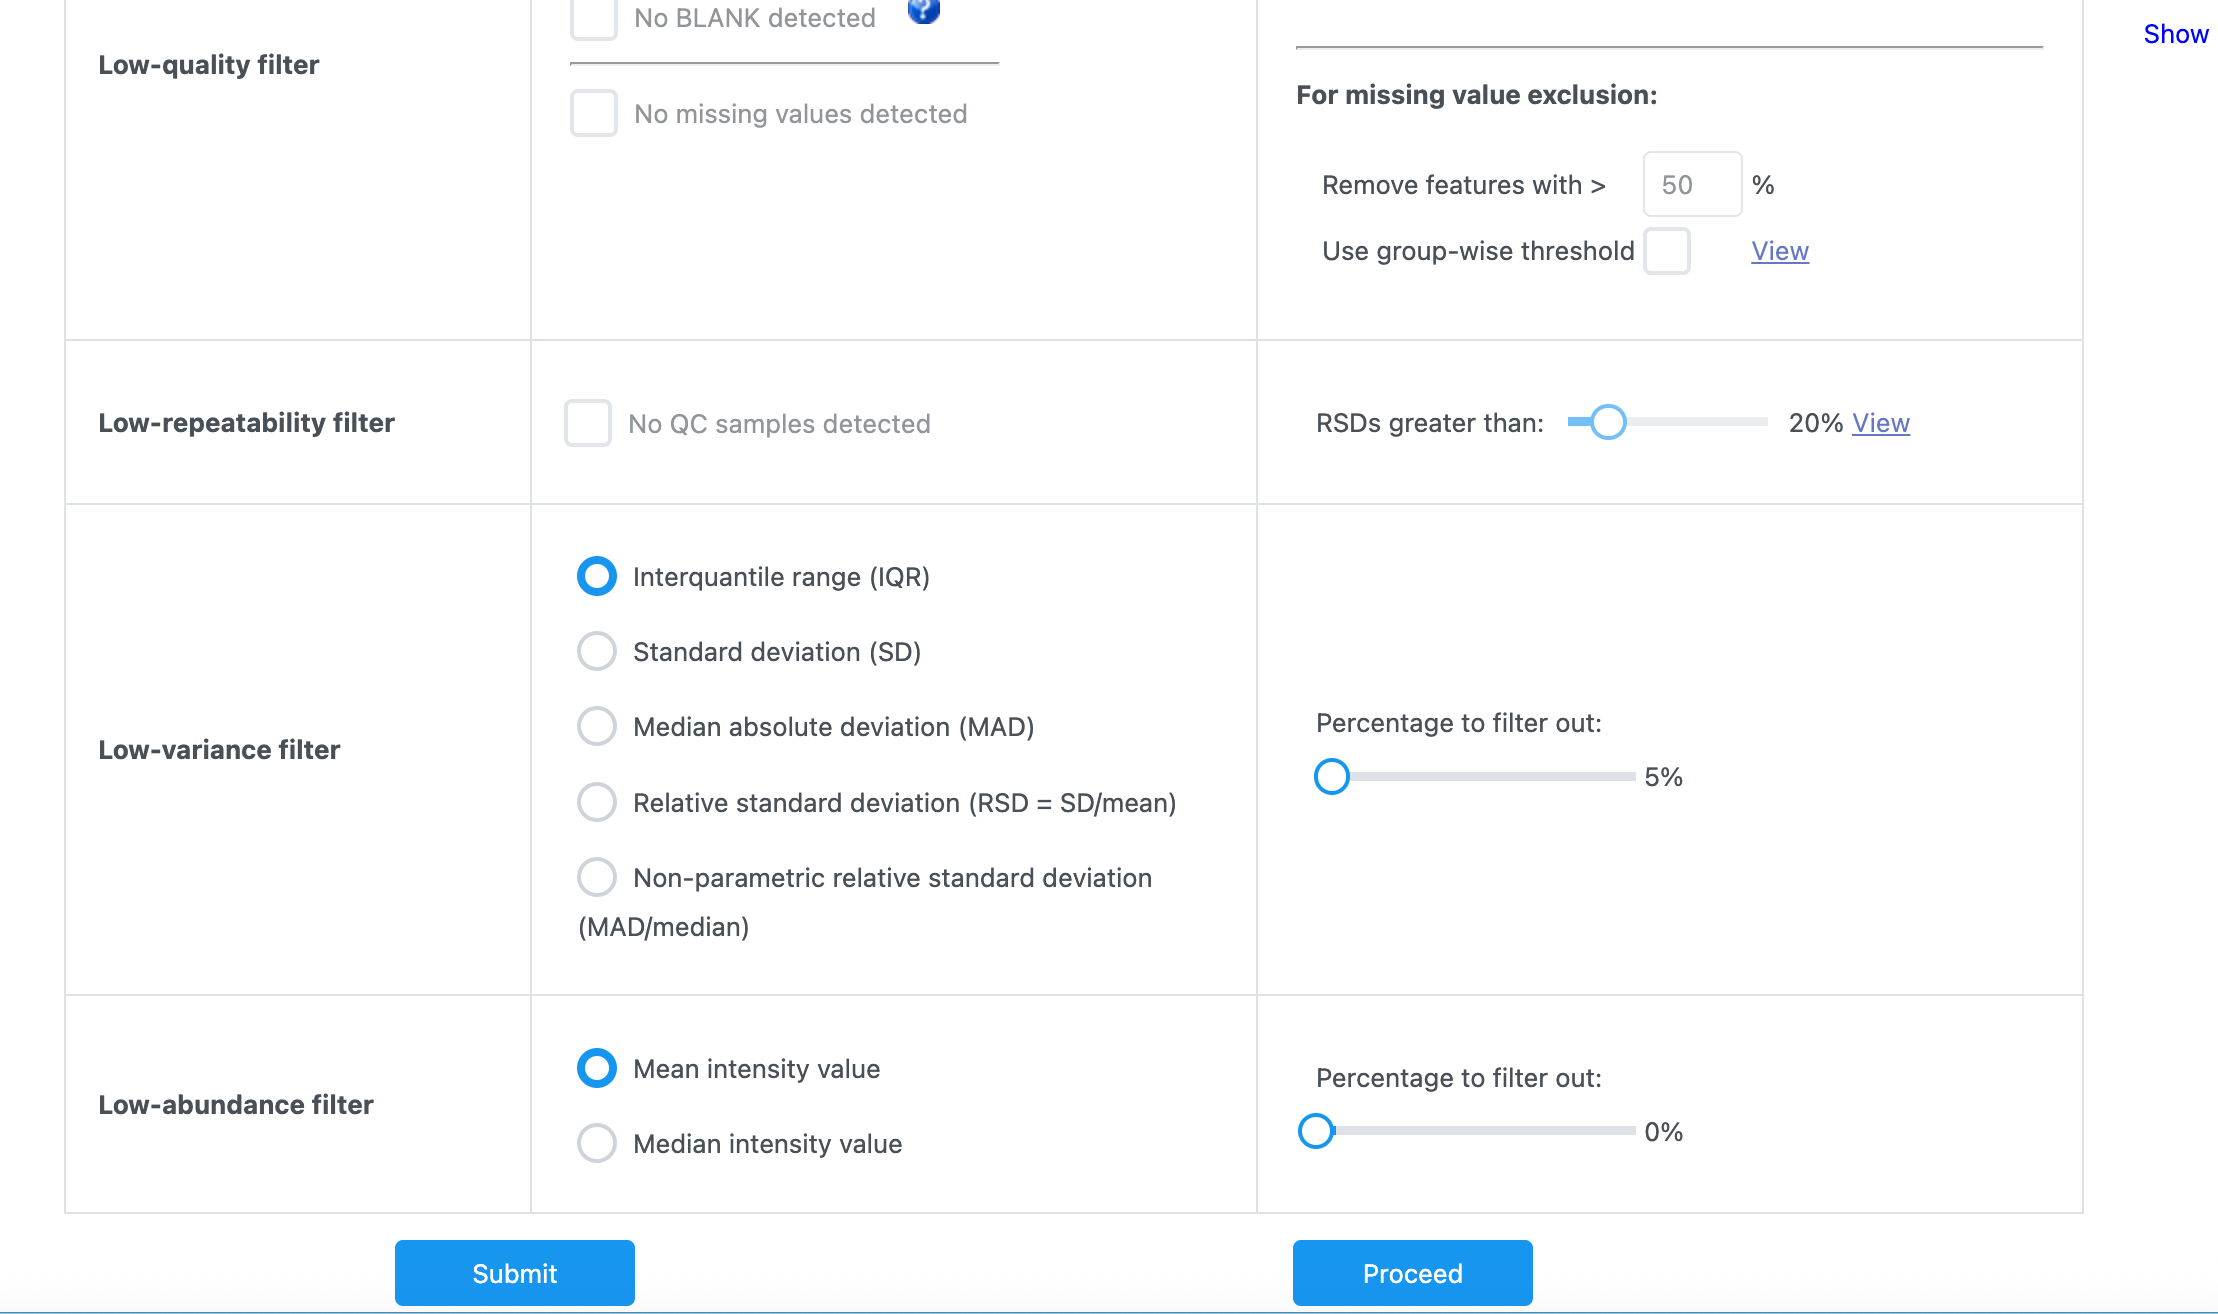
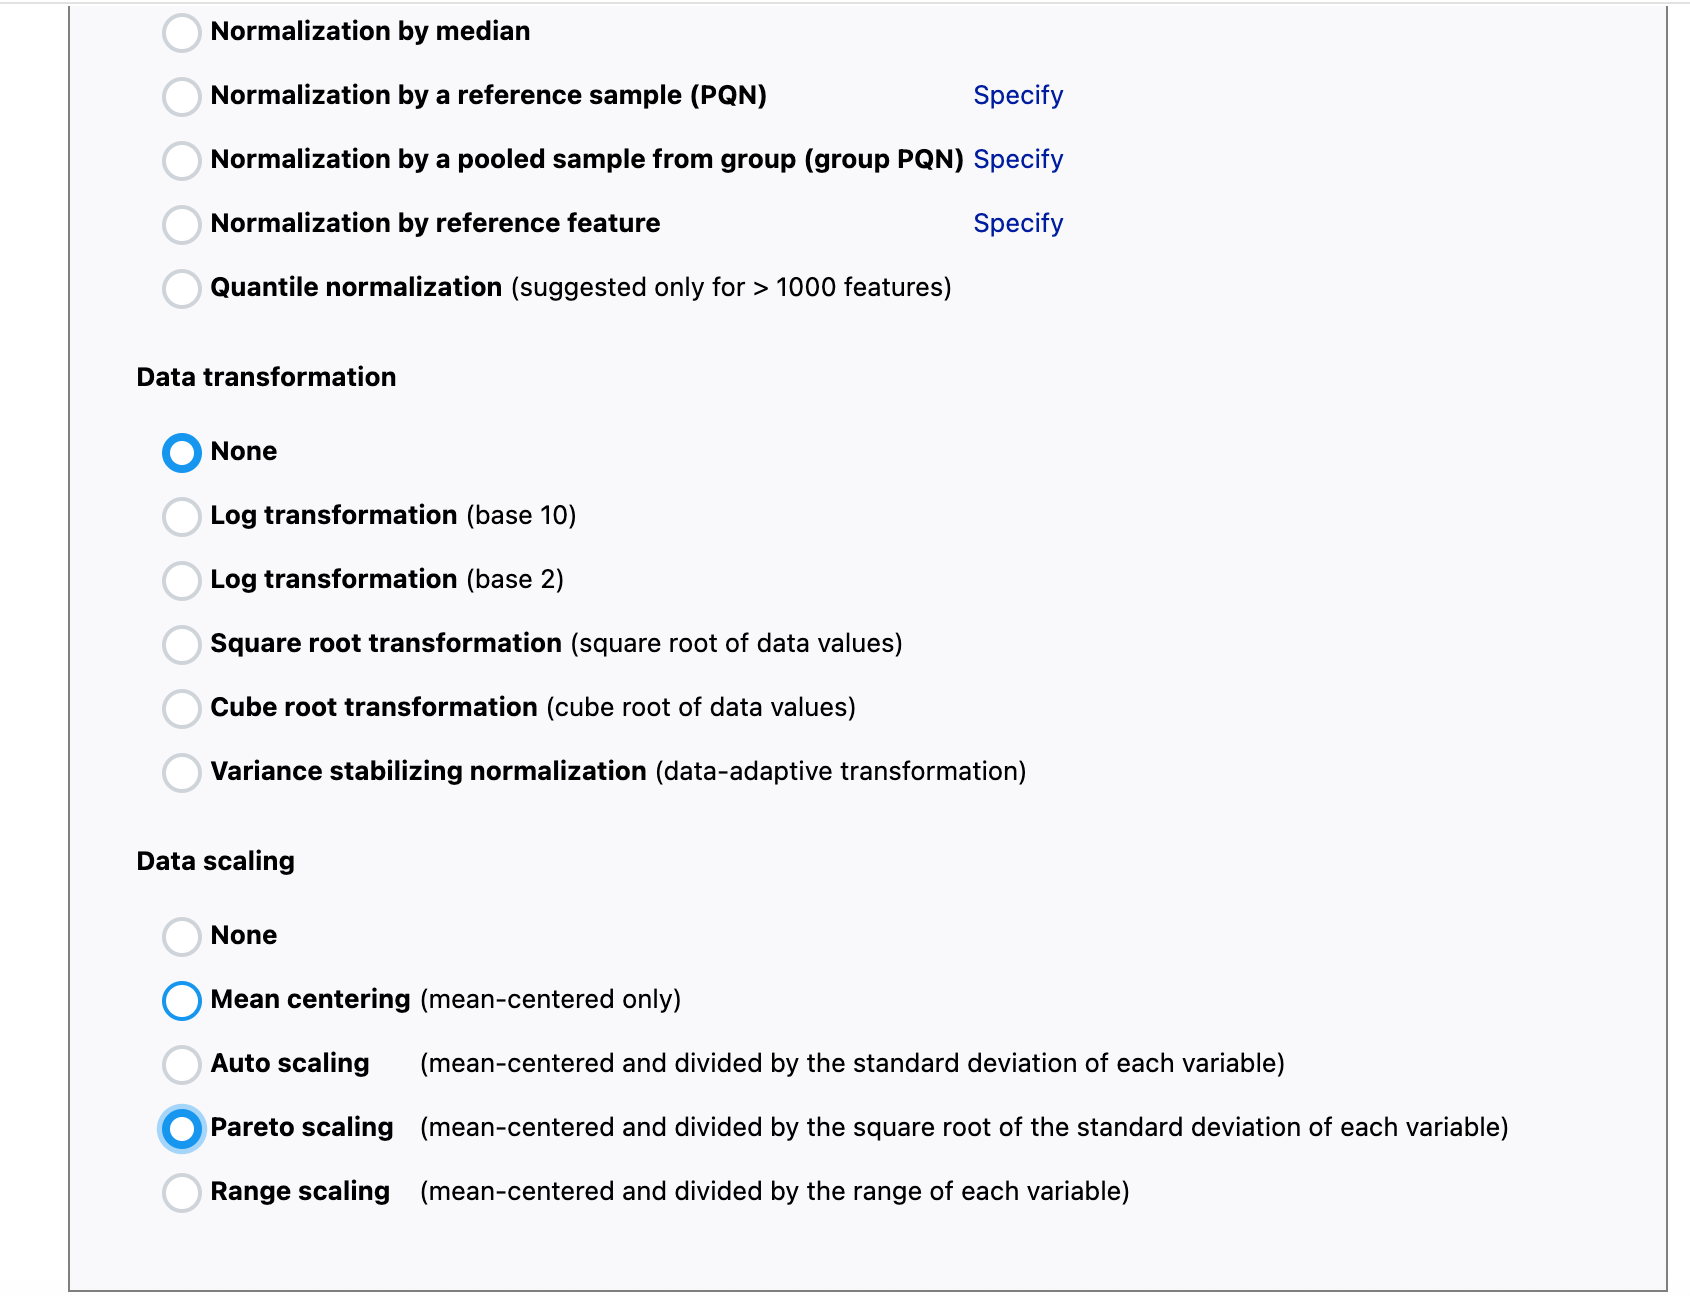
Steps: They have been uploaded as screenshots. The data settings I chose were Peak Intensities; Sample in columns; Pareto Scaling; Target Group as CBD, and Reference group as CTR.
MetaboAnalyst is designed for interactive exploration. You need to click a variable to generate the plot. Automatic workflow and project management are features for pro tools
Alright I understand thank you. I am a high school student, so all of this is relatively new to me. One question I had was in my research paper would I be able to still include the ROC curve analysis despite it showing all AUC values as 1 because I want to upload the Random Forest analysis as that analysis does provide me with important lipid species. I was wondering this because I have never seen a research paper where the Random Forest is included but the ROC curve is not. I would appreciate your thoughts!
This tool is designed for senior graduate students and life science researchers who are familiar with molecular biology, with basic knowlege in stats and machine learning (but don’t do programming)
If you would like to learn machine learning => please use a proper data with decent size.
If you would like to understand the data itself => PCA and t-tests => read papers on those significant features and their potential functions / pathways