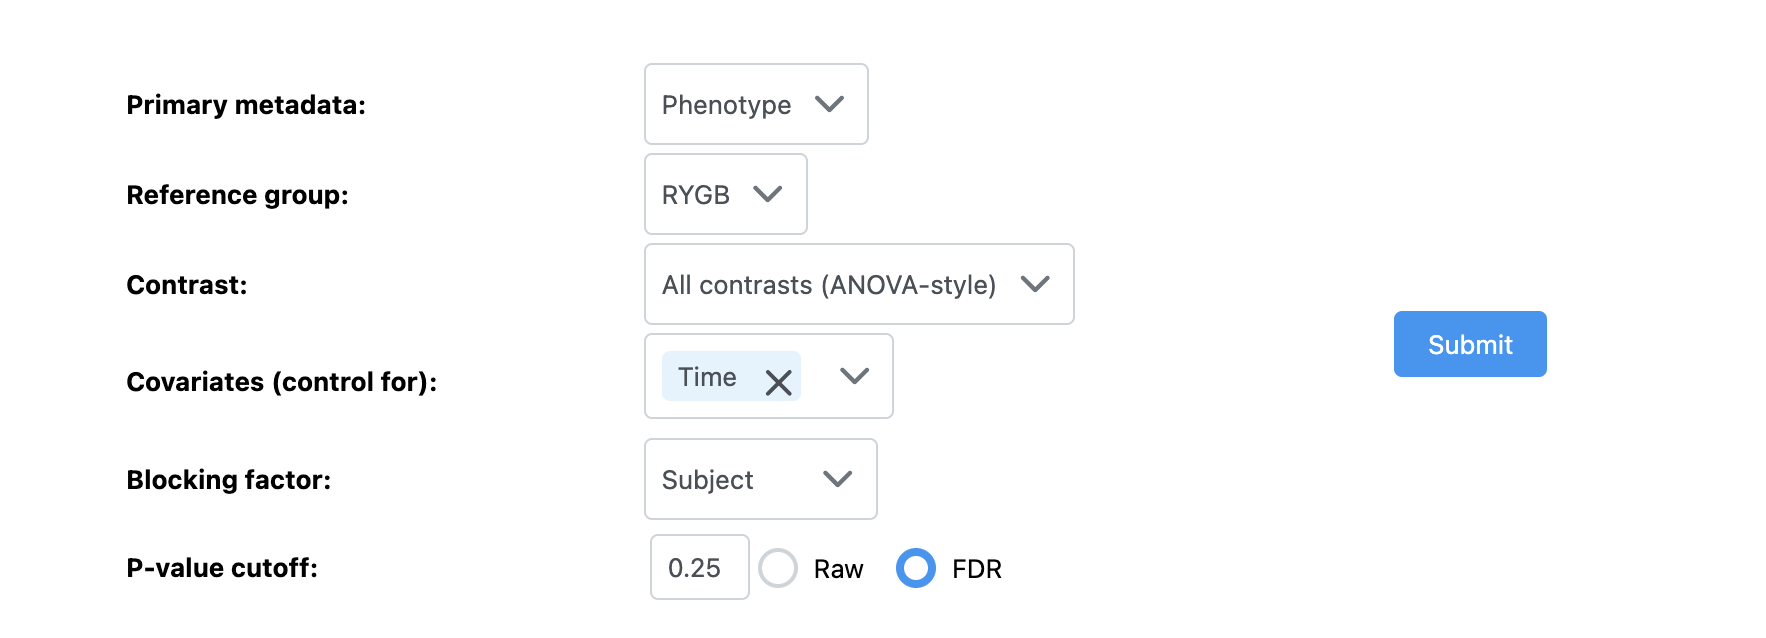
I am performing some troubles with performing linear models in my time series-one factor design (two points and two treatments). I have tried with older data that I already analysed in this manner, and now I have encountered that the analysis is not performed with this message: “The analysis is not performed yet” that it is the same message that is posted from the beginning. Are there any bug in the code in the web version? anybody knows how to proceed?
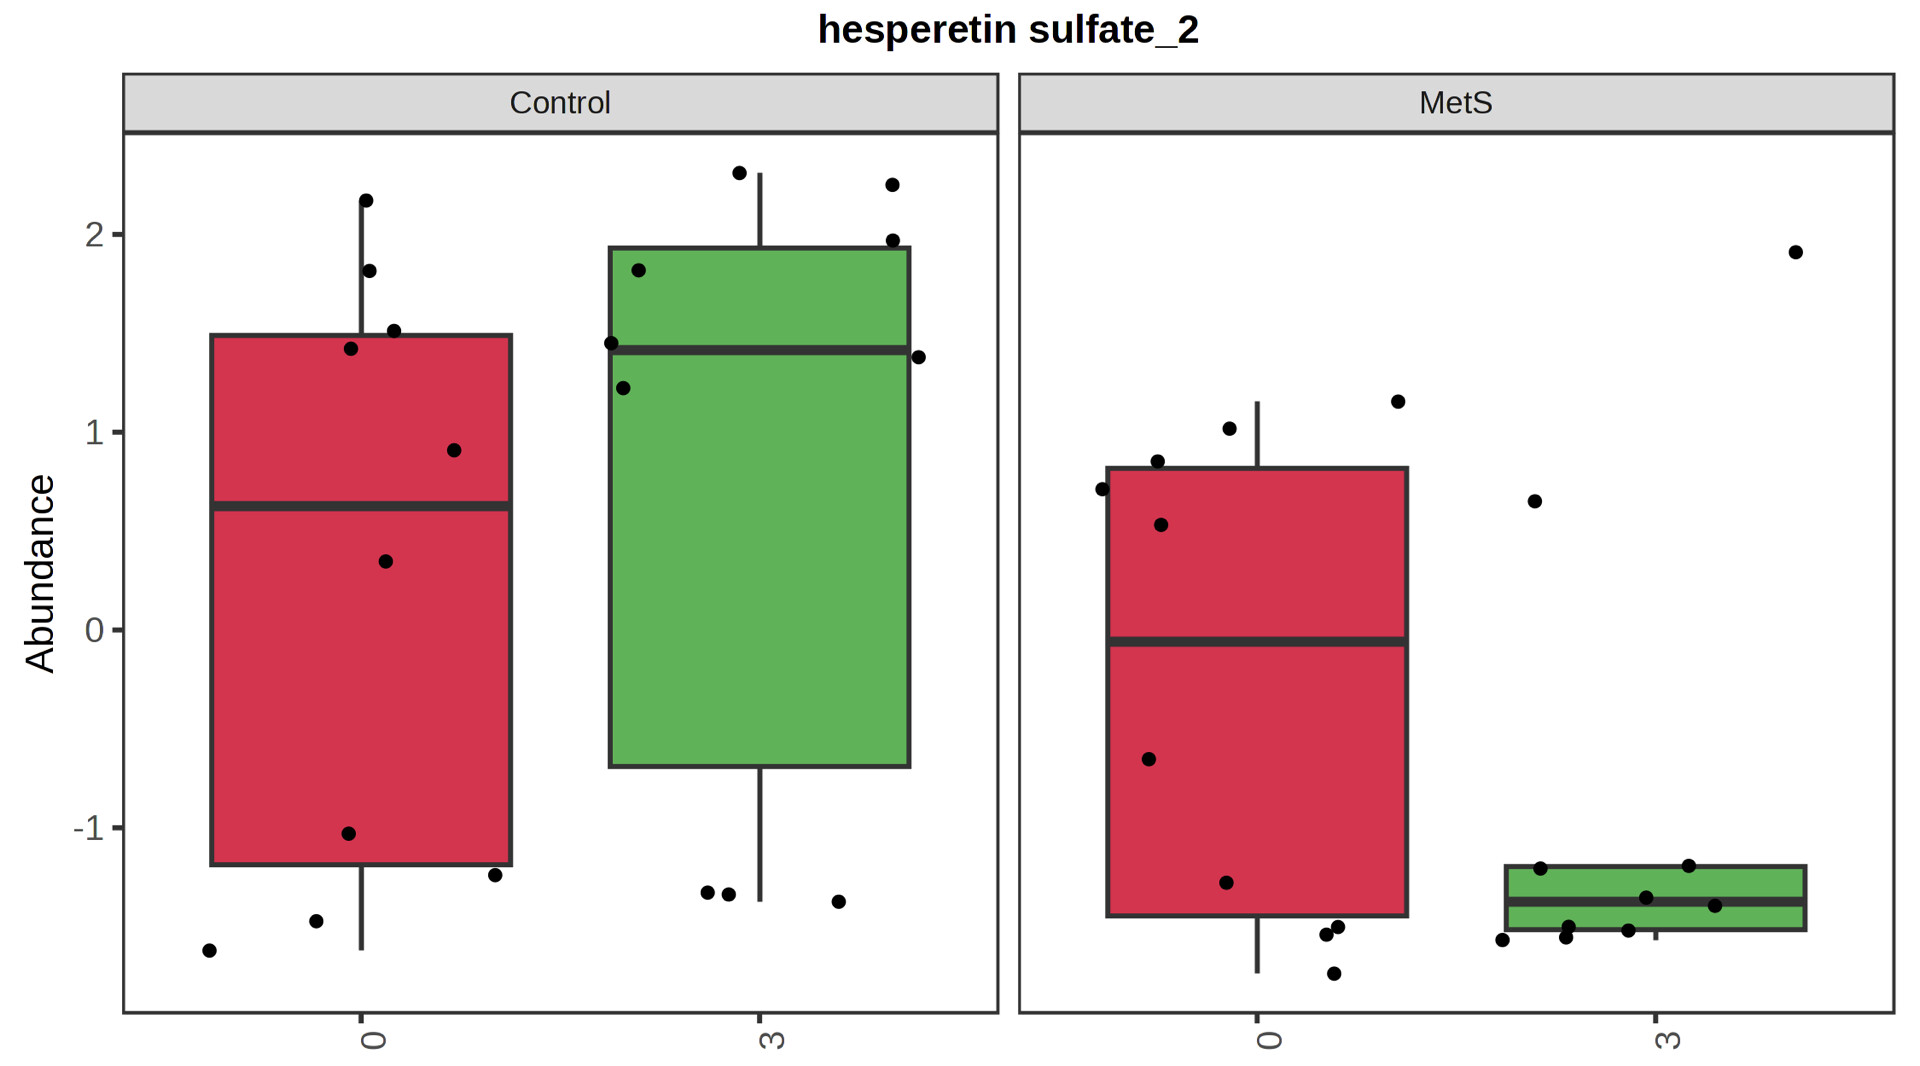
As you can see, I have two different groups at two different times, so I would like to use the time-series + 1 factor approach in order to look for the metabolites that differently change between groups. I expect to obtain something similar to this:
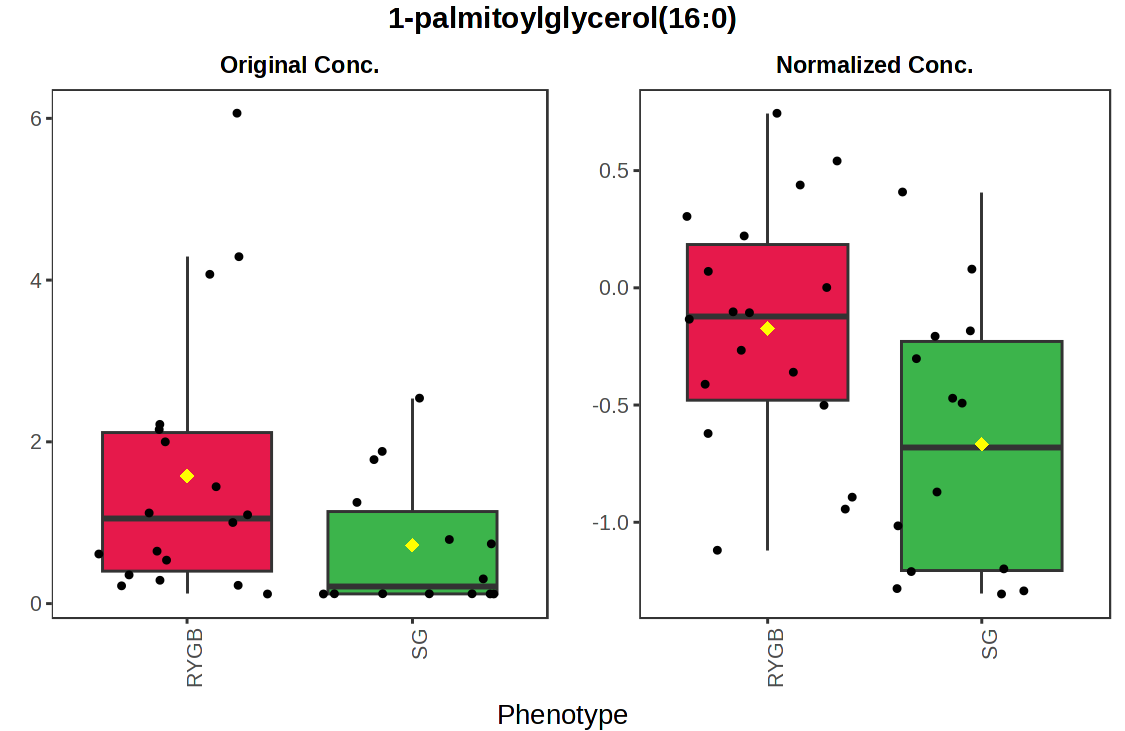
that I obtained previously with other data, but exactly the same design. However, now, this kind of figure is impossible to obtained, as I obtained this:
You should be able to get the plot using the default “Multiple factors / covariates” design, not 'Time-series + 1 factor" design. I see your data contain only two time points which is not sufficient for time series analysis.
Note here you treat “Time” group as two categorical values (T0/T1).