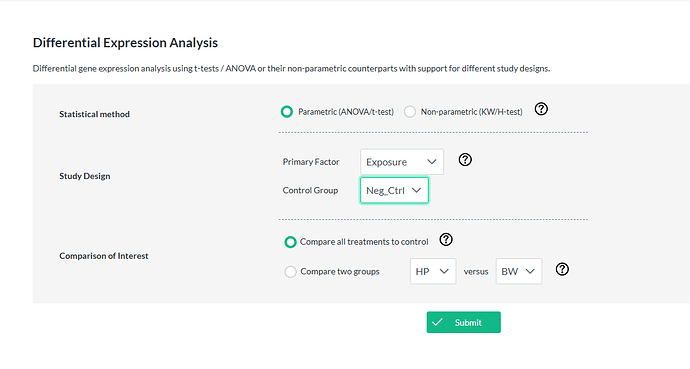
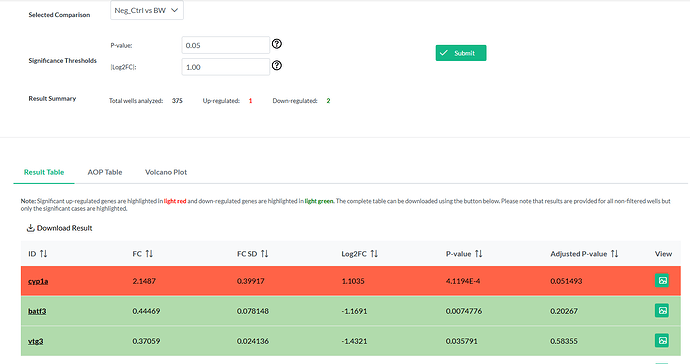
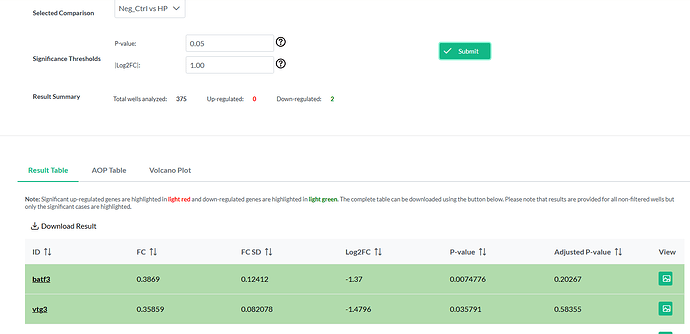
Hello, when looking through the data for DE genes, I’ve noticed that they don’t change between each comparison. I am working with the “Exposure” DE analysis, so we are comparing different treatments to a control sample. The Log2FC number does change with each comparison (ie control vs Trt A, Control vs. Trt B), but the p values and adjusted p values do not change. Is this to be expected? I am used to obtaining a different p value for each comparison. Thank you!
Stacey
To clarify the above post, I am using Ecotox Xplorer, ver. 1.0, P. promelas species and looking at differential expression, not dose response. I am comparing the data from a negative lab water control to a positive control and 4 different sites/treatements
Steps taken- First image shows how I’ve select the input method for the differential expression. The second and third images are comparisons between the negative control and two of the sites. As you can see, the p-values remain the same in both comparisons. I’ve also included the plots for the genes shown in the second and third images
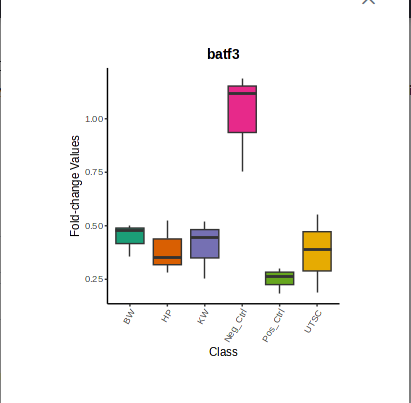
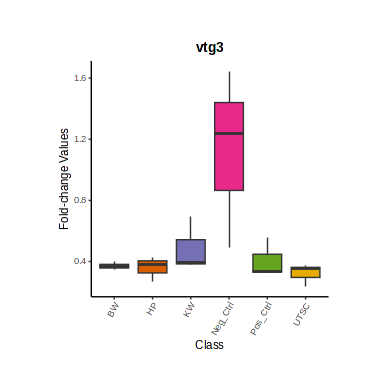
Hopefully this helps to explain my above comment better. I was just wondering if it’s expected that the Log2FC changes if the p-values do not.
Thank you,
Stacey
I see that you chose the “all compared to control” in the first page, this is one test (similar to ANOVA) with one p-value. If you would like to use p-values specific for your comparison in the 2nd page, you need to choose the same comparison in the first page.
The behavior is documented (see below)
This topic was automatically closed after 3 days. New replies are no longer allowed.
