Here’s my response following the guidelines:
- Which tool and which module:
Statistical Analysis → Statistics → Orthogonal PLS-DA
- Provide a copy of your data:
Cf. attached file: DataMatrix.csv (207.8 KB)
- Document all steps leading to the issue. Sometimes screenshots may be necessary:
- Module: Statistical Analysis
- Data upload:
a. Data Type: Peak intensities
b. Format: Samples in rows (unpaired)
c. Data File: DataMatrix.csv (207.8 KB)
- Data Integrity Check: Proceed (no check done or needed)
- Data Filtering: Proceed (no filtering done or needed)
- Data Editor:
a. Edit Groups
b. Available: GRP1; GRP2
c. Exclude: BLNK; GRP3; GRP4; GRP5; POOL
d. Group order matters: no
- Normalization:
a. Sample normalization: none
b. Data transformation: none
c. Data scaling: Pareto scaling
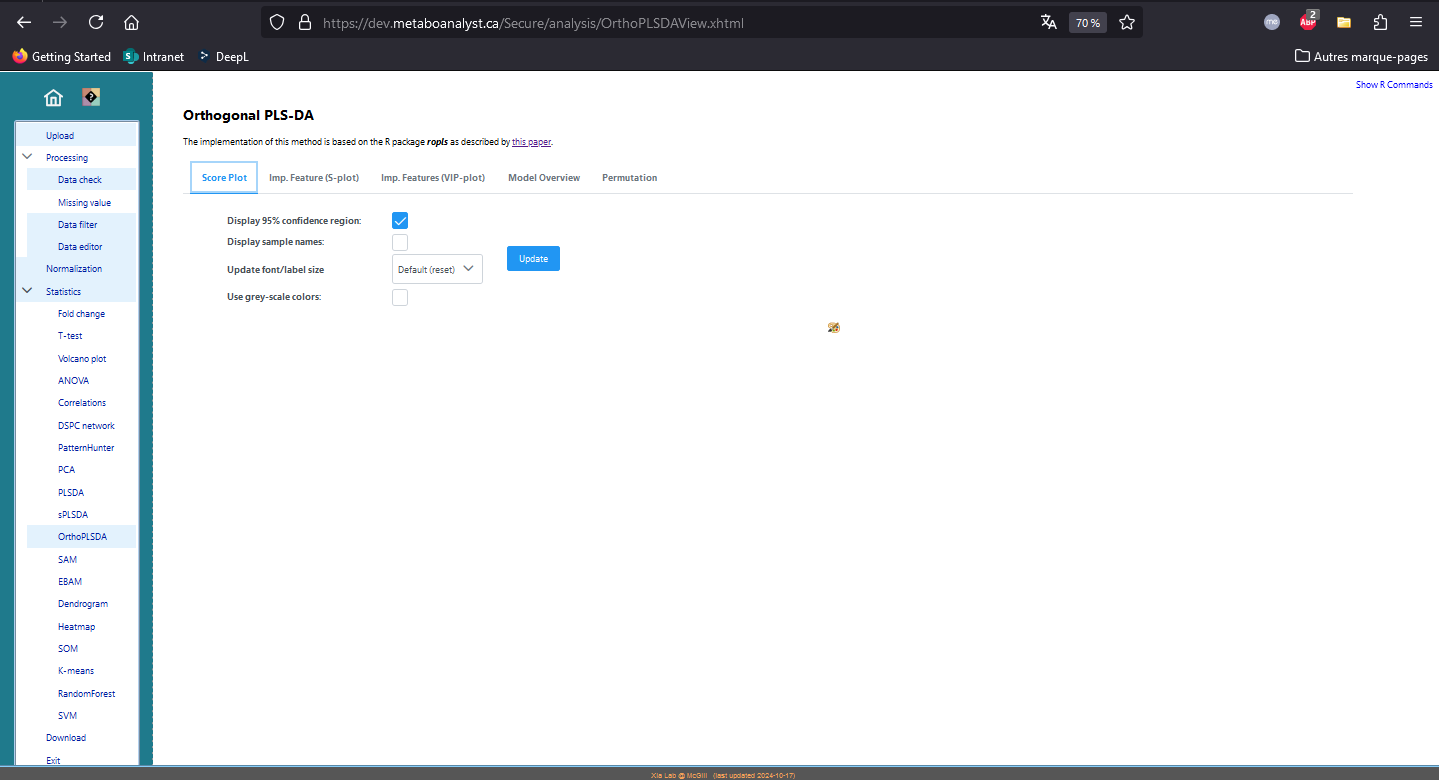
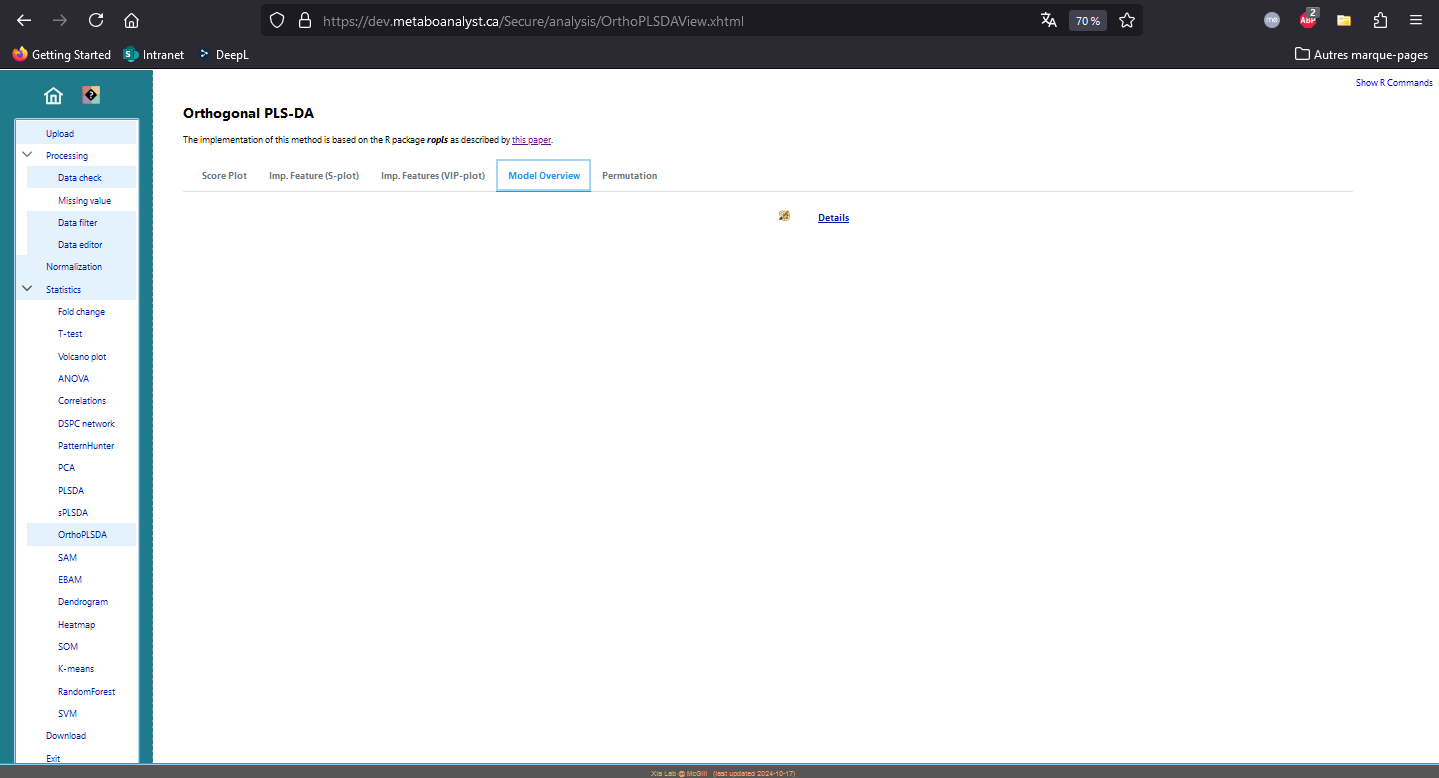
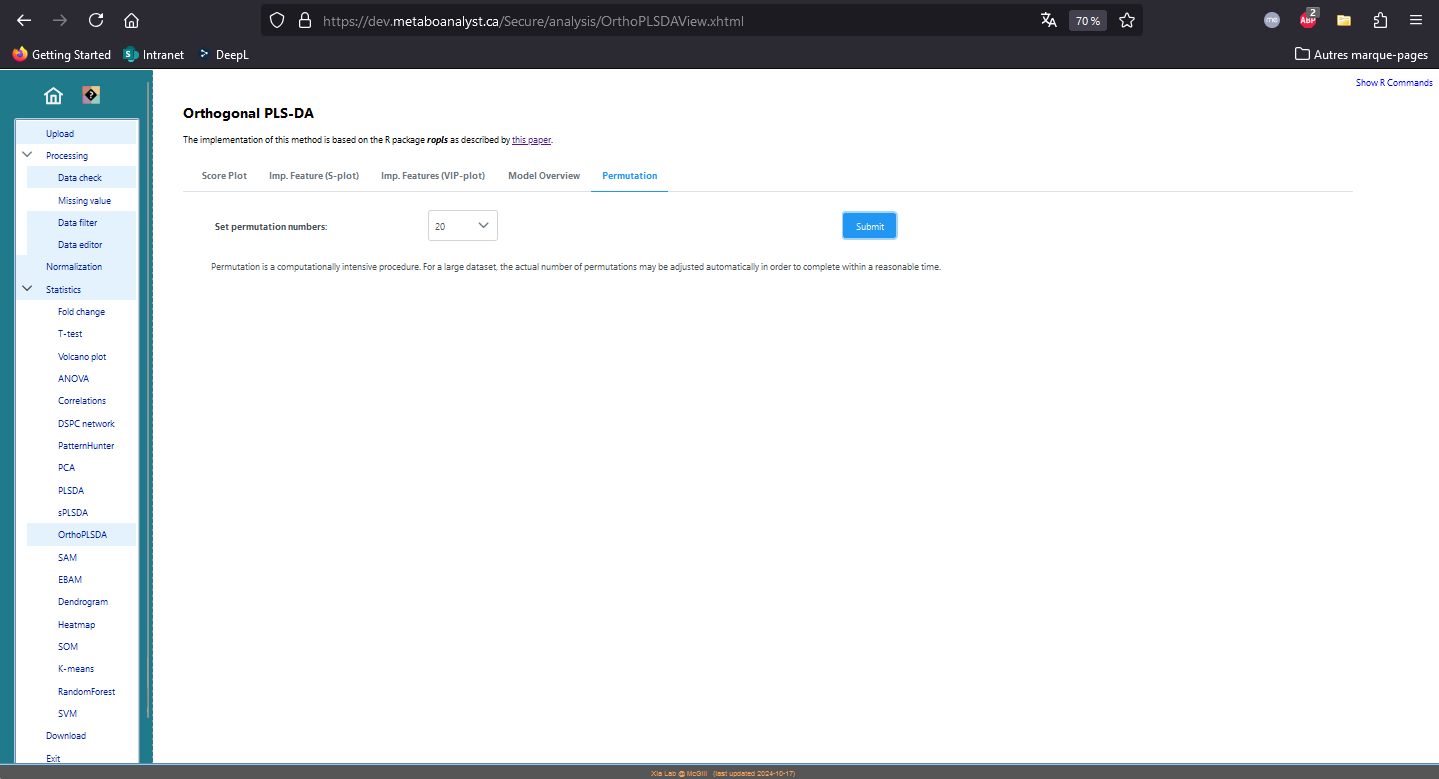
- Select an analysis path to explore: Orthogonal Partial Least Squares - Discriminant Analysis (orthoPLS-DA)
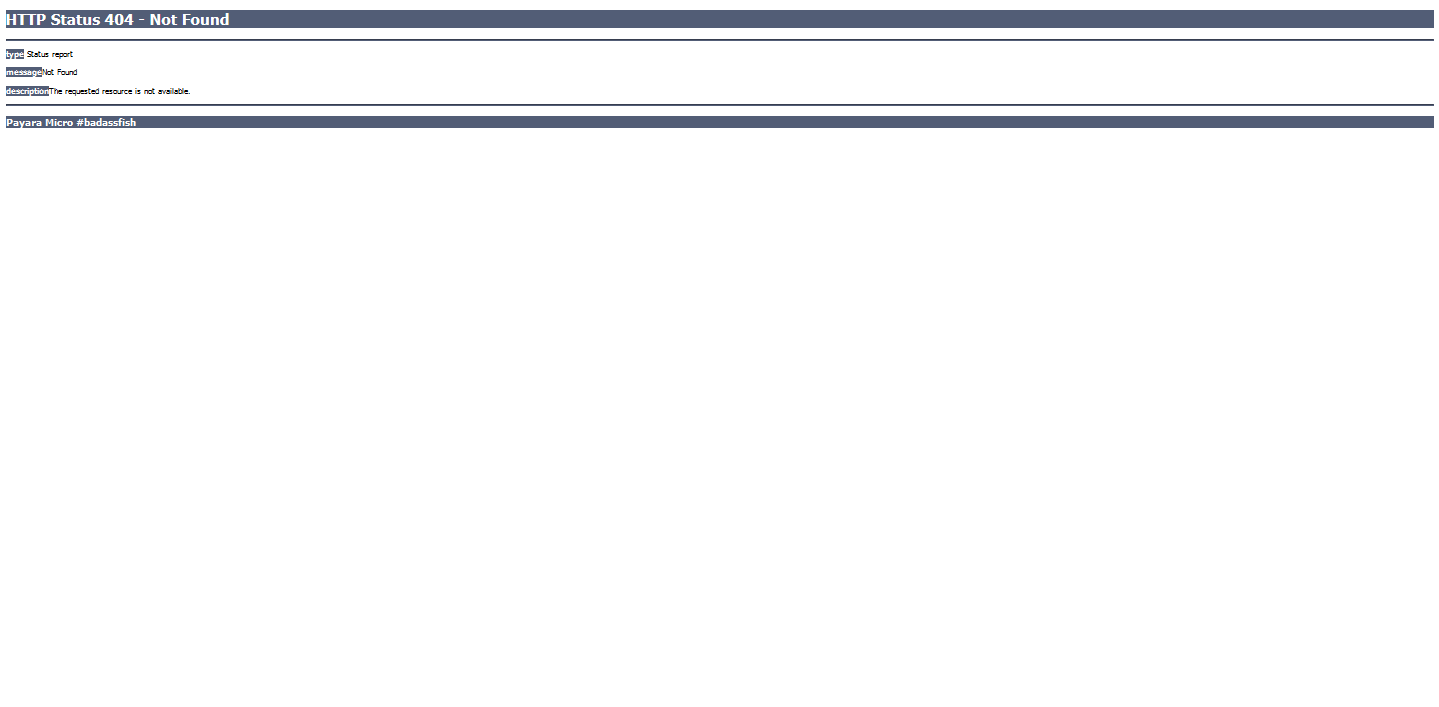
- Orthogonal PLS-DA: Cf. screenshots in attachments (even when clicking on “Update” or “Submit”, no results can be acquired)
- If it is about using R packages, you also need to provide the environment information, such as sessionInfo():
R Command History (online platform):
|1. |mSet<-InitDataObjects(pktable, stat, FALSE)|
|2. |mSet<-Read.TextData(mSet, Replacing_with_your_file_path, rowu, disc);|
|3. |mSet<-SanityCheckData(mSet)|
|4. |mSet<-ReplaceMin(mSet);|
|5. |mSet<-SanityCheckData(mSet)|
|6. |mSet<-FilterVariable(mSet, F, 25, none, -1, mean, 0)|
|7. |mSet<-PreparePrenormData(mSet)|
|8. |mSet<-GetGroupNames(mSet, )|
|9. |feature.nm.vec ← c()|
|10. |smpl.nm.vec ← c()|
|11. |grp.nm.vec ← c(GRP1,GRP2)|
|12. |mSet<-UpdateData(mSet, F)|
|13. |mSet<-PreparePrenormData(mSet)|
|14. |mSet<-Normalization(mSet, NULL, NULL, ParetoNorm, ratio=FALSE, ratioNum=20)|
|15. |mSet<-PlotNormSummary(mSet, norm_0_, png, 72, width=NA)|
|16. |mSet<-PlotSampleNormSummary(mSet, snorm_0_, png, 72, width=NA)|
|17. |mSet<-OPLSR.Anal(mSet, reg=FALSE)|
|18. |mSet<-PlotOPLS2DScore(mSet, opls_score2d_0_, png, 72, width=NA, 1,2,0.95,0,0, na)|
|19. |mSet<-PlotOPLS.Splot(mSet, opls_splot_0_, all, png, 72, width=NA);|
|20. |mSet<-PlotOPLS.Imp(mSet, opls_imp_0_, png, 72, width=NA, vip, tscore, 15,FALSE)|
|21. |mSet<-PlotOPLS.MDL(mSet, opls_mdl_0_, png, 72, width=NA)|
|22. |mSet<-PlotOPLS2DScore(mSet, opls_score2d_1_, png, 72, width=NA, 1,2,0.95,0,0, na)|
|23. |mSet<-UpdateOPLS.Splot(mSet, all);|
|24. |mSet<-PlotOPLS.Splot(mSet, opls_splot_1_, all, png, 72, width=NA);|
|25. |mSet<-UpdateOPLS.Splot(mSet, none);|
|26. |mSet<-PlotOPLS.Splot(mSet, opls_splot_2_, none, png, 72, width=NA);|
|27. |mSet<-PlotOPLS.Imp(mSet, opls_imp_1_, png, 72, width=NA, vip, tscore, 15,FALSE)|
|28. |mSet<-OPLSDA.Permut(mSet, 20)|
|29. |mSet<-PlotOPLS.Permutation(mSet, opls_perm_0_, png, 72, width=NA)|
|30. |mSet<-OPLSDA.Permut(mSet, 1000)|
|31. |mSet<-PlotOPLS.Permutation(mSet, opls_perm_1_, png, 72, width=NA)|
- If it is about raw data processing, please also describe how the data were collected (instrumentation, etc).:
Not applicable