I am using MetaboAnalyst to compare two LC-MS treatment groups. After an unpaired t-test I uploaded the significant metabolites and obtained several pathways with low p-values, indicating they are perturbed between the groups.
Could you please advise on the best way to decide whether a significant pathway is overall up-regulated or down-regulated? Specifically:
Does the Pathway Analysis output include a built-in aggregate metric that already captures pathway directionality?
If not, is the recommended approach to interpret per-metabolite fold-changes and calculate an aggregate statistic externally?
Is there a workflow you suggest when describing pathway directionality in a manuscript?
A similar question on pathway direction for targeted metabolomics can be found here. Overall, there is no reliable metrics nor biologically meaningful interpretation on the overall pathway direction (please provide references you know on this topic).
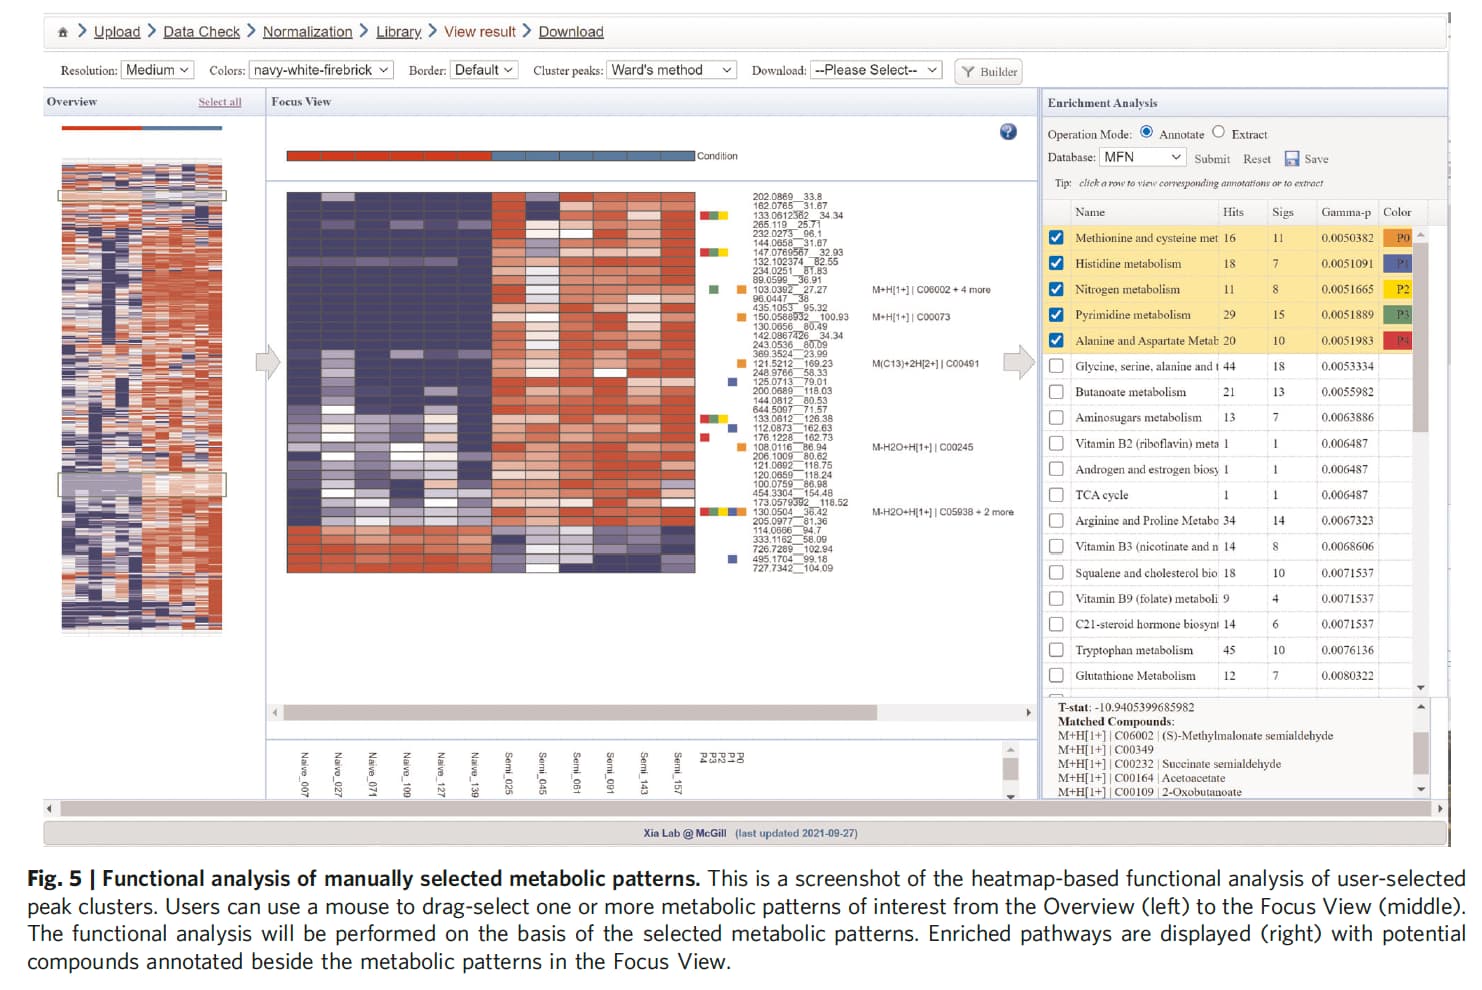
In my view, the most useful approach is always thinking about your data, the question, and visualization (with some assistance from statistics). MetaboAnalyst allows you to visualize every LC-MS peaks invovled in a pathway, it is up to you to provide interpretation (and validation). See Figure 5 from our 2022 Nature Protocol