I am new to metabolomics but was tasked to do MSEA using metaboanalyst ( Quantitative Enrichment analysis).
In my data, I have two conditions; let’s call them control vs. treated.
I am having trouble understanding the results:
Enrichment ratio: the number of hits within a particular metabolic pathway divided by the expected number of hits.
Is it in the control? In treated? In the difference between them? I am so lost.
You also get a table with the Metabolite set with P-values, FDR, etc. But how can I know which pathway is upregulated in which condition?
I understand this is a complex topic, and I appreciate your patience navigating it. I’ve tried to find answers online, but I’m still struggling to understand the concept of a ‘perturbed’ pathway.
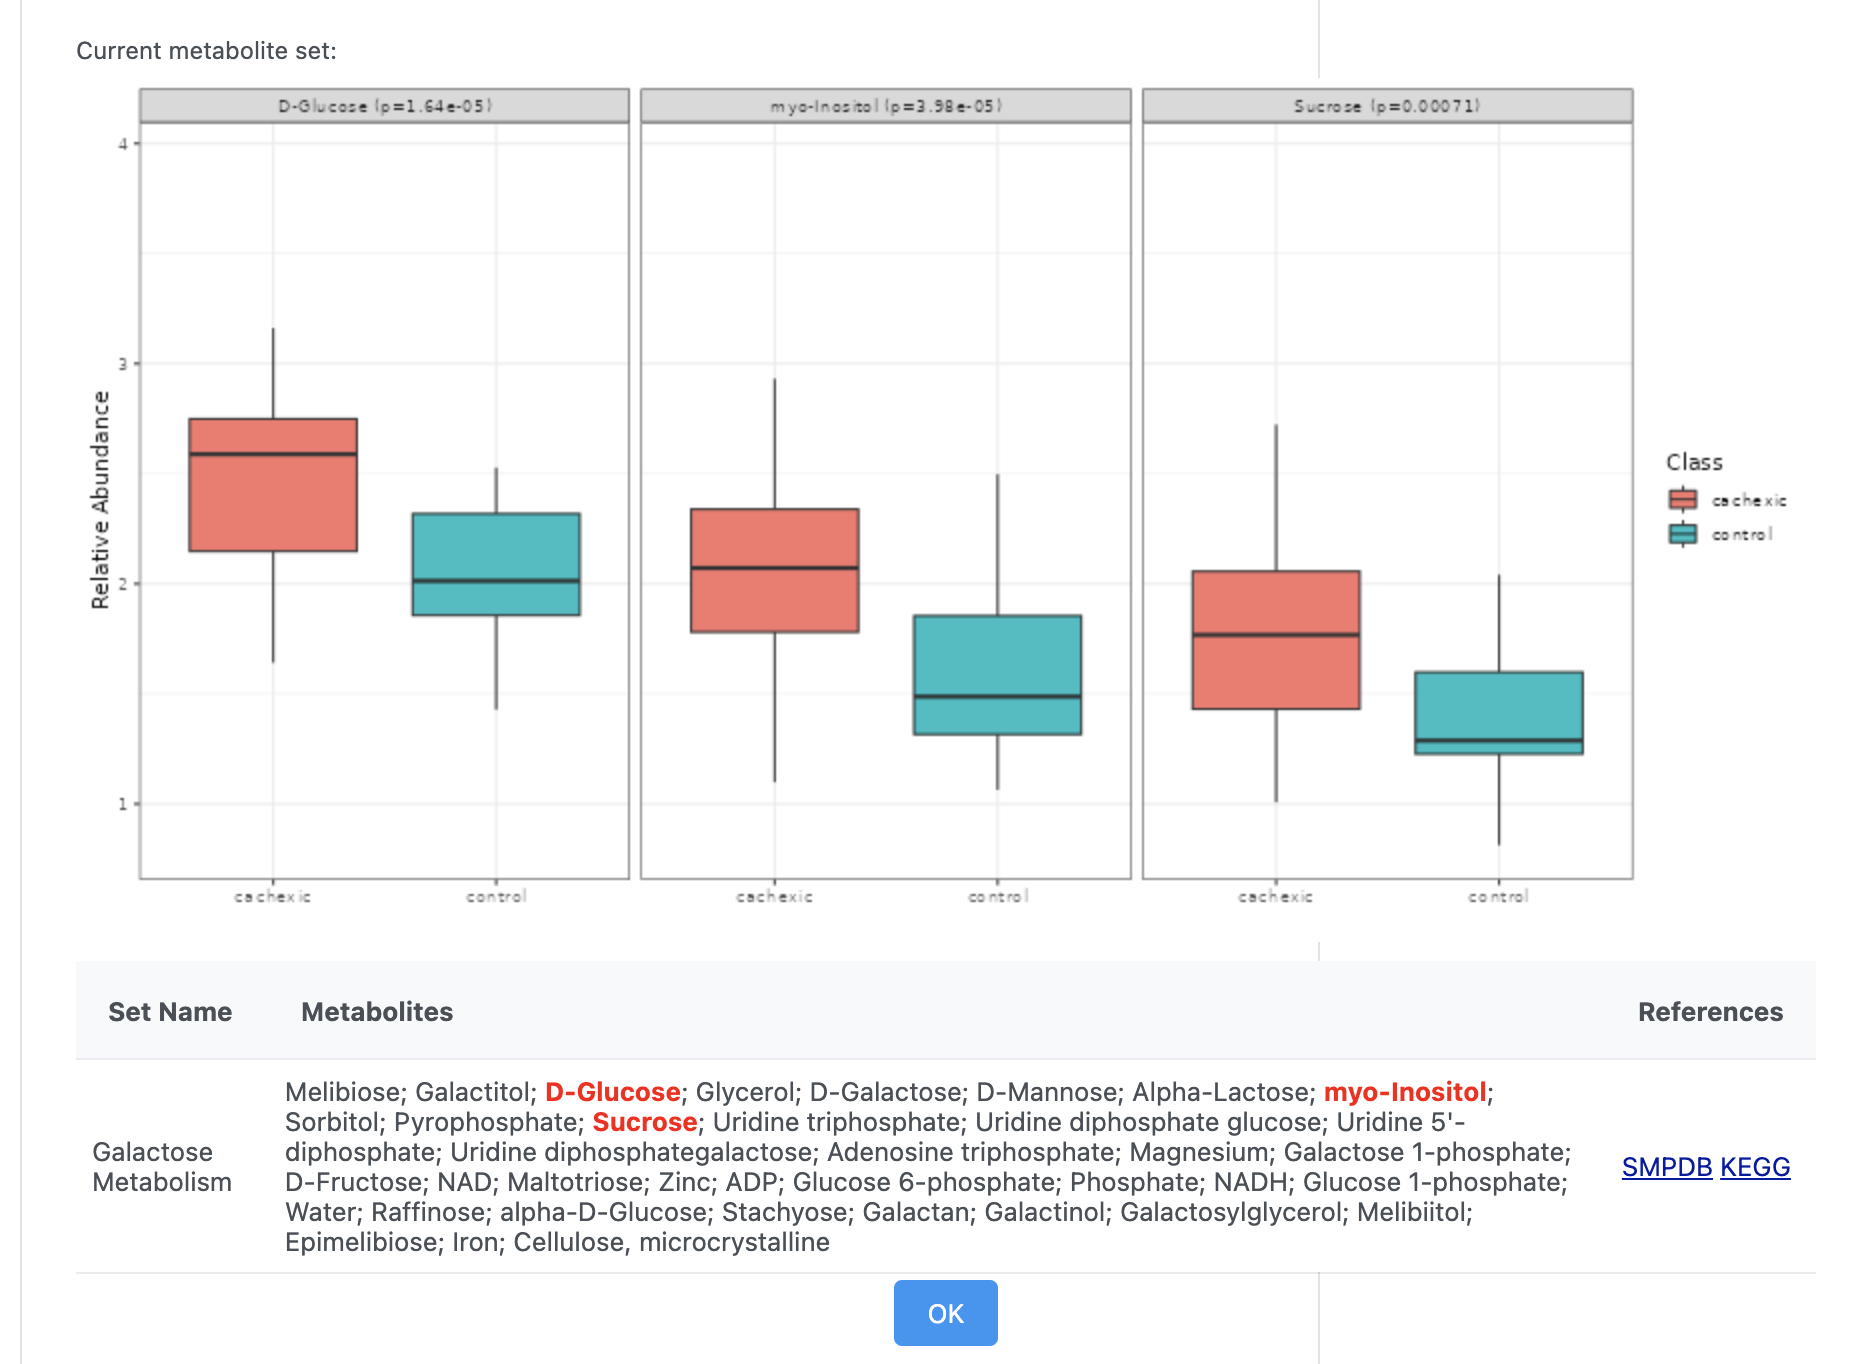
Regarding pathway hits and pathway directions - assuming you are performing targeted metabolomics based on quantitative enrichment analysis (QEA). Each pathway will have a “View” button, or you can directly click the node in the network (see below generated from our example data #1)
There are 3 hits in this example (note they are present in BOTH groups). Pathway up- or down-regulation is not well defined since metabolites can be substrate or product in the pathway. It is just dysregulated. However, you can view individual compounds (i.e. box plot below) to come up with the directionality. The example below is consistent, but many cases the directions are mixed.