In MetaboAnalyst volcano plots, not all statistically significant metabolites are labeled even when they pass the FC and p-value thresholds. Could you clarify how the labeling algorithm selects features for annotation? Is there an internal ranking based on effect size, adjusted p-value, or plot readability constraints? Additionally, is there a way to force labeling of all significant metabolites?

I enter the same parameters as in the picture you sent, but the result tells me that there are 31 sign-up and 11 sign-down metabolites, but when I download the plot, the number labeled is very small. How can I fix this?
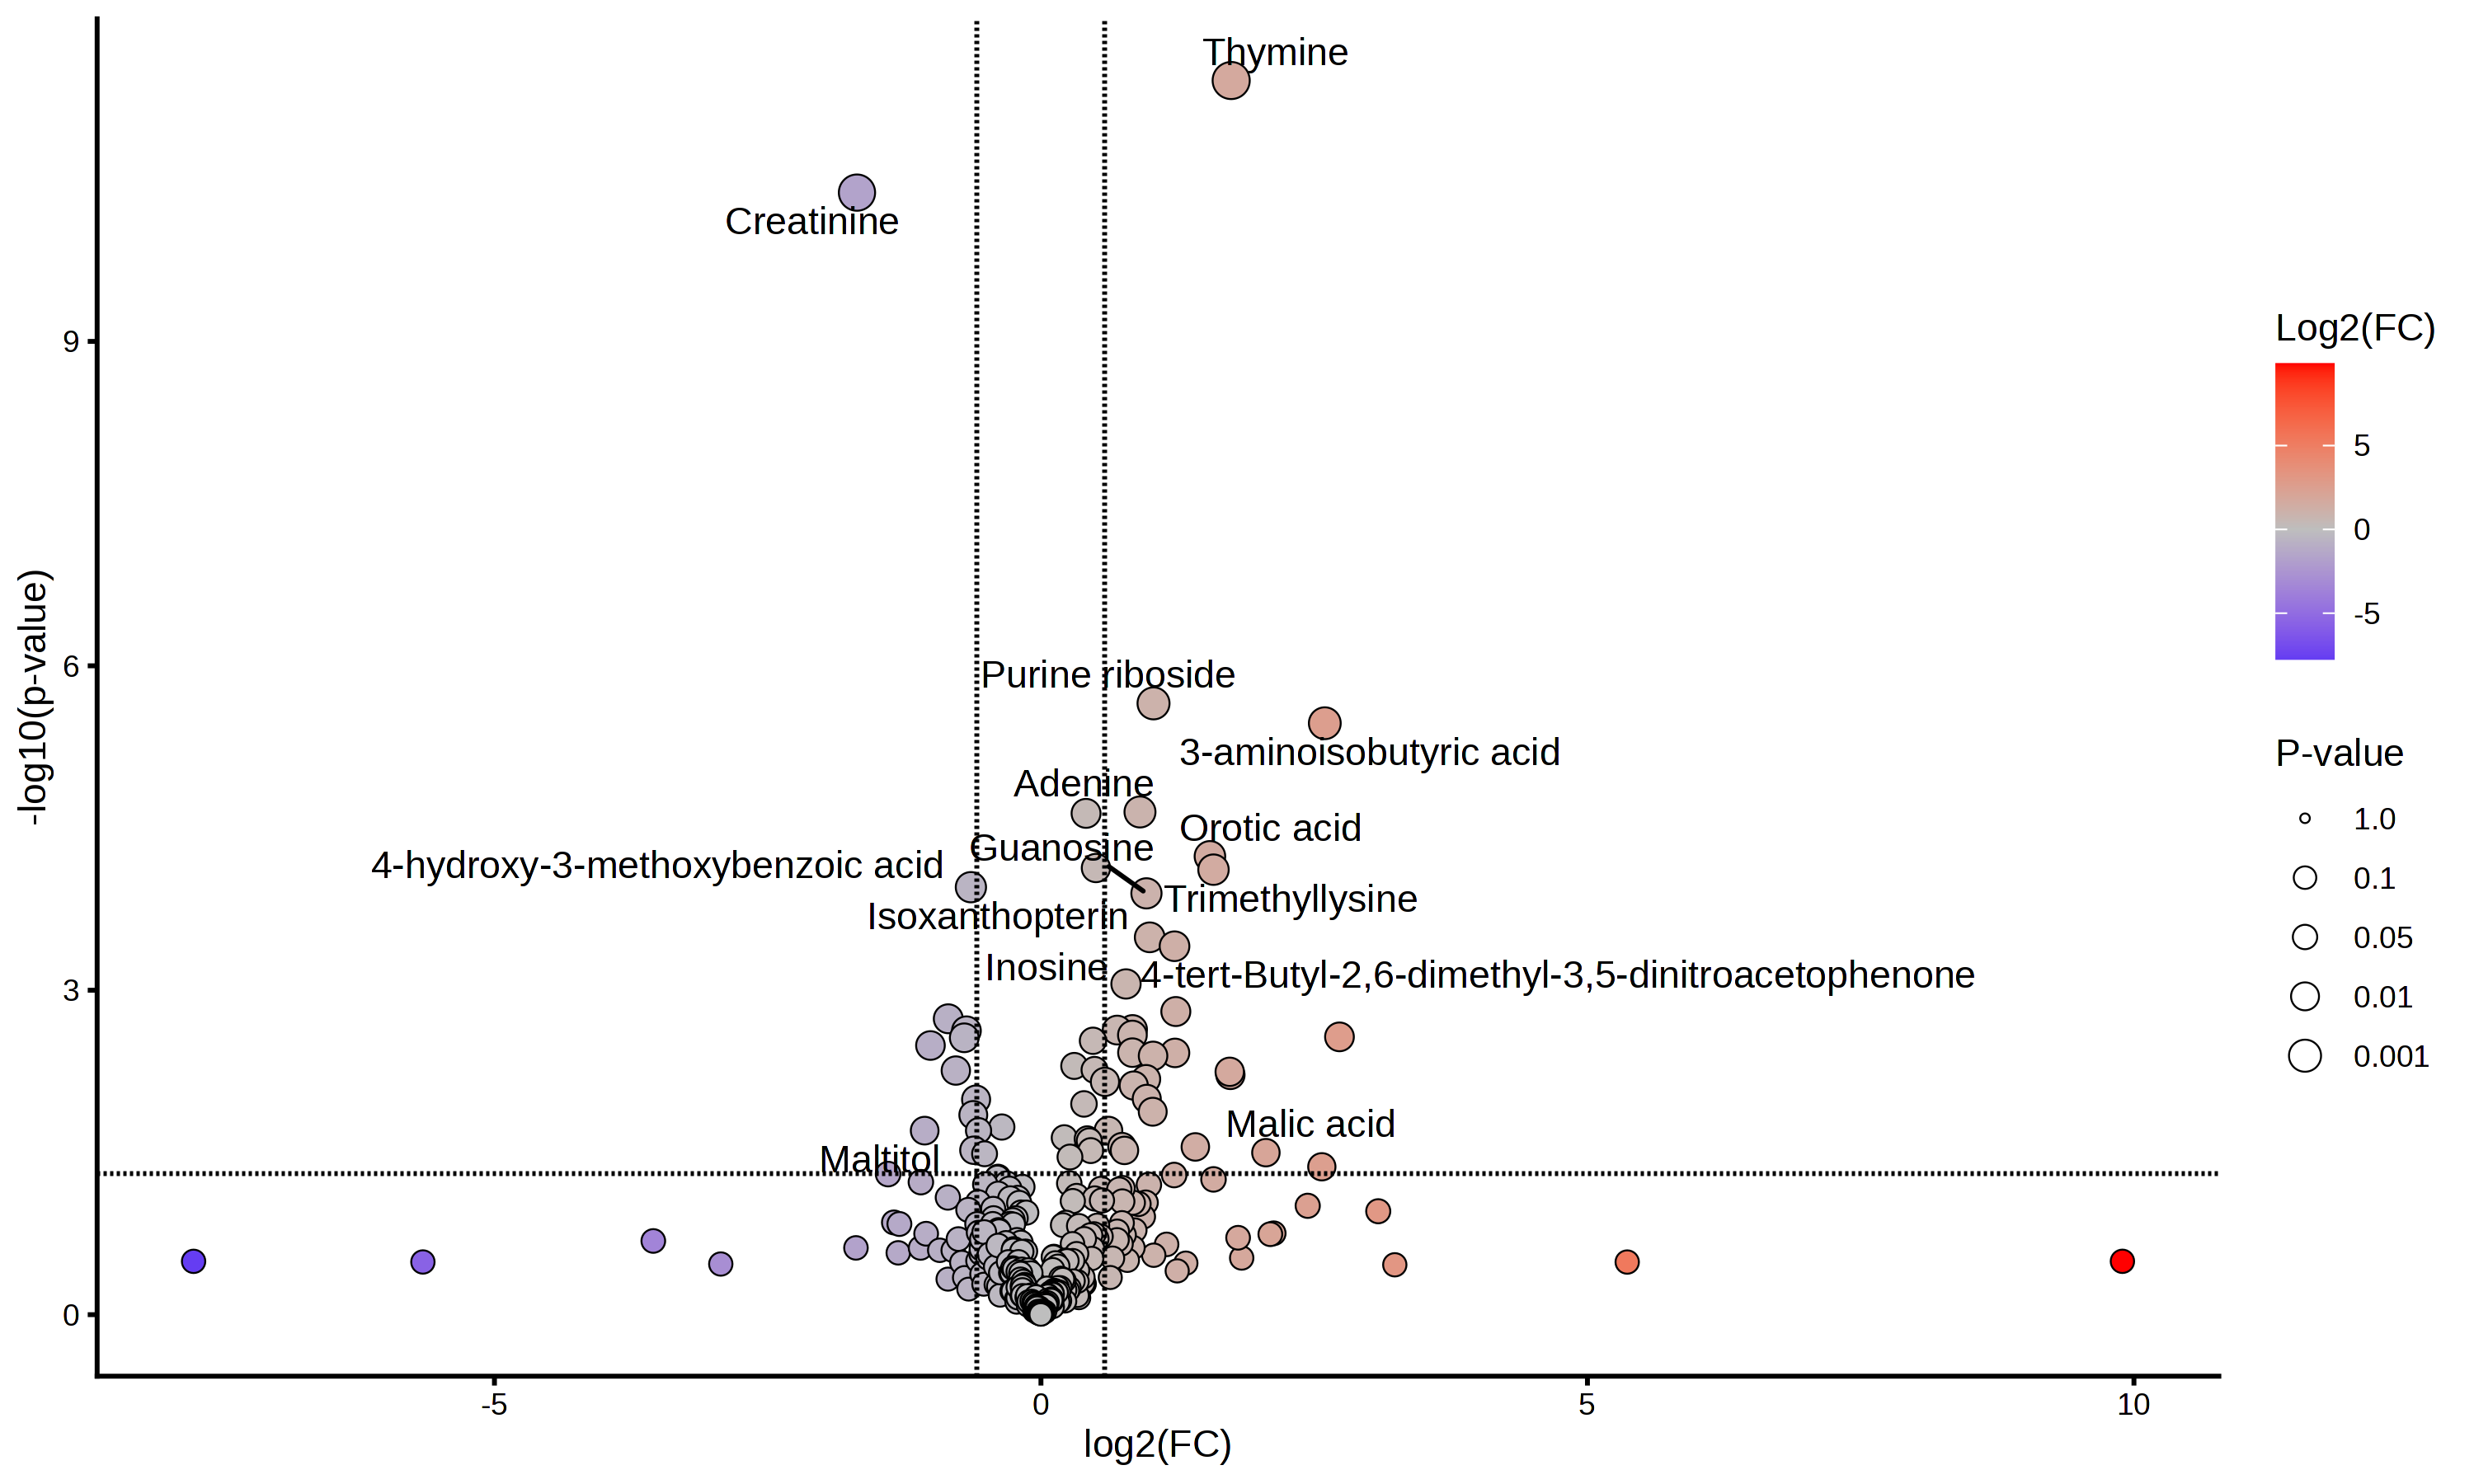
Can you give it a try? Should be fixed
Hi,
This issue should be fixed now. MetaboAnalyst and MetaboAnalyst-Pro has been updated.
Please try and let us know.
Best regards,
Zhiqiang
hello! I am having a similar issue with metaboanalyst. The volcano plot generated looks correct. However, when I go to download the images as a jpeg or pdf, the dots corresponding to anything with a log p value >9 disappear. The labels remain in the jpeg and pdf, but there are no corresponding dots on the actual volcano plot.
Just tested on our example and no issue noticed. Please provide more details as described in our post guide.