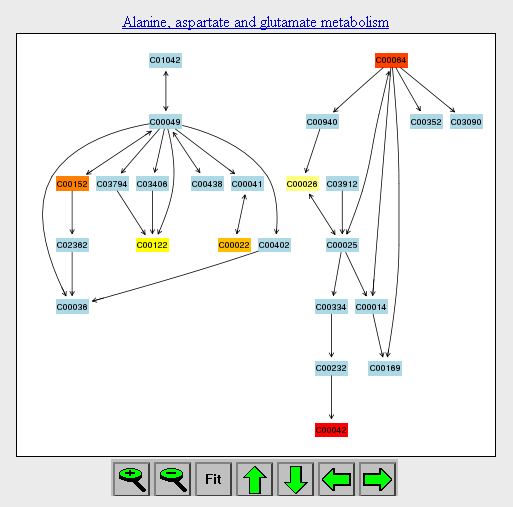
An example of “pathway view” is shown below. It shows the current metabolic pathway after user clicks the corresponding node on the “metabolome view”. The pathway is essentially a simplified KEGG pathway map shown only chemical compounds.
- The default node color is light blue. The matched nodes will show varied heat map colors based on their p values.
- When a reference metabolome is provided, some compounds will be colored in light grey if they are not within the reference metabolome.
- The common compound names can be obtained via mouse over tool-tip. Click on any node will reveal more detailed information as well as database links. For matched compounds, it will also include images summarizing the concentration distribution of the corresponding compound (see [compound view](https://www.omicsforum.ca/t/how-to-interpret-the-compound-view-in-pathway-analysis/167)).