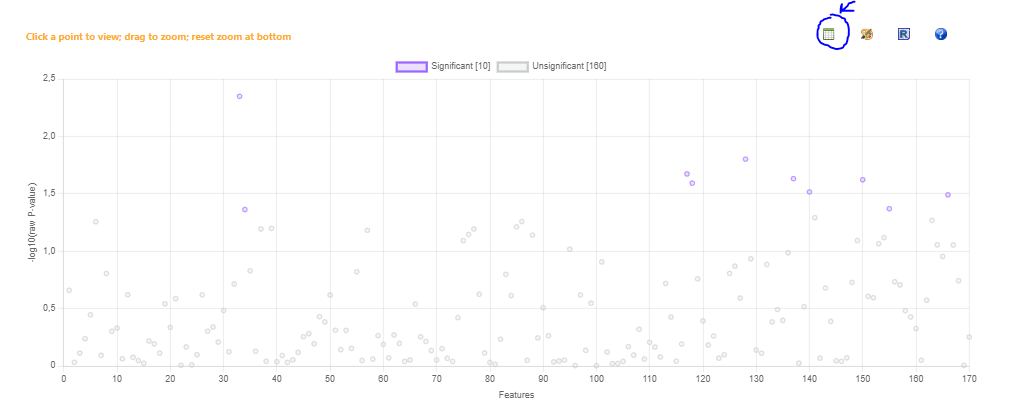
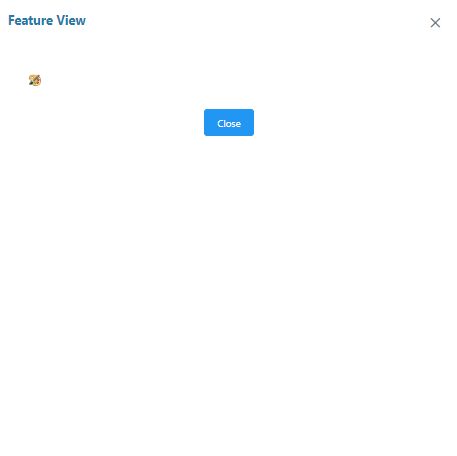
Hi! I am doing the statistical analysis for my thesis data at Metabanalyst. However, when I do the univariate analysis and try to see the box plots of each significant feature, I can’t. It’s impossible, and I don’t understand why… everything appears white!
Thank you so much for your time. and Thank you in advance for your help.
Hello Jeff,
Thank you for your reply, I’m sorry for not following the requirements correctly.
The Tool I use is MetaboAnalyst and the module is statistical analysis (metadata table). When I insert my bucket table (attached) I normalize the data and when I do the t-test univariate analysis, what I send in the following images appears.
Bucket_table_csv (n=25).csv (76.7 KB)
I see there are empty spaces after every feature names - they cannot be recognized properly by computer. It is also not a good practice to use numbers as feature names