I am trying to generate a heatmap of functional analysis (Mummichog, p-value cutoff 1.0E-5, version 1.0, Heatmap with either Gallus gallus or E.coli as the pathway library). There are pathways that populate the right side when I choose Annotate (with KEGG selected) and hit submit but when I click on any of these boxes, a column is created for the pathway but no square appears. Does anyone have ideas of what may be occurring?
Most likely that you have selected a large region and the hits are outside the current view => scroll down
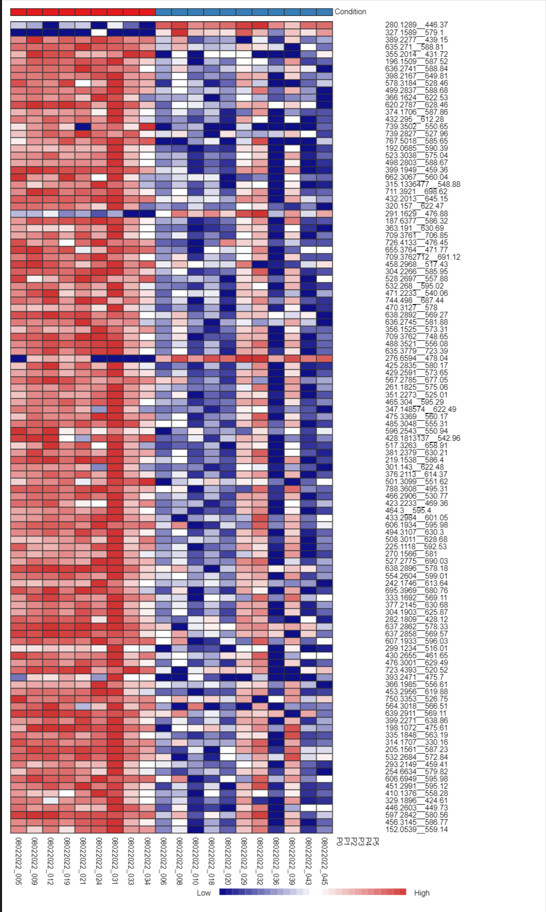
I tried selecting a larger section and scrolling down. Here is a view of the heatmap after I downloaded it with the pathways selected on the right. The columns appear as I choose different pathways but no boxes populate the figure in the columns indicating pathways.
How did you get here? You need to follow our post guideline