Hello,
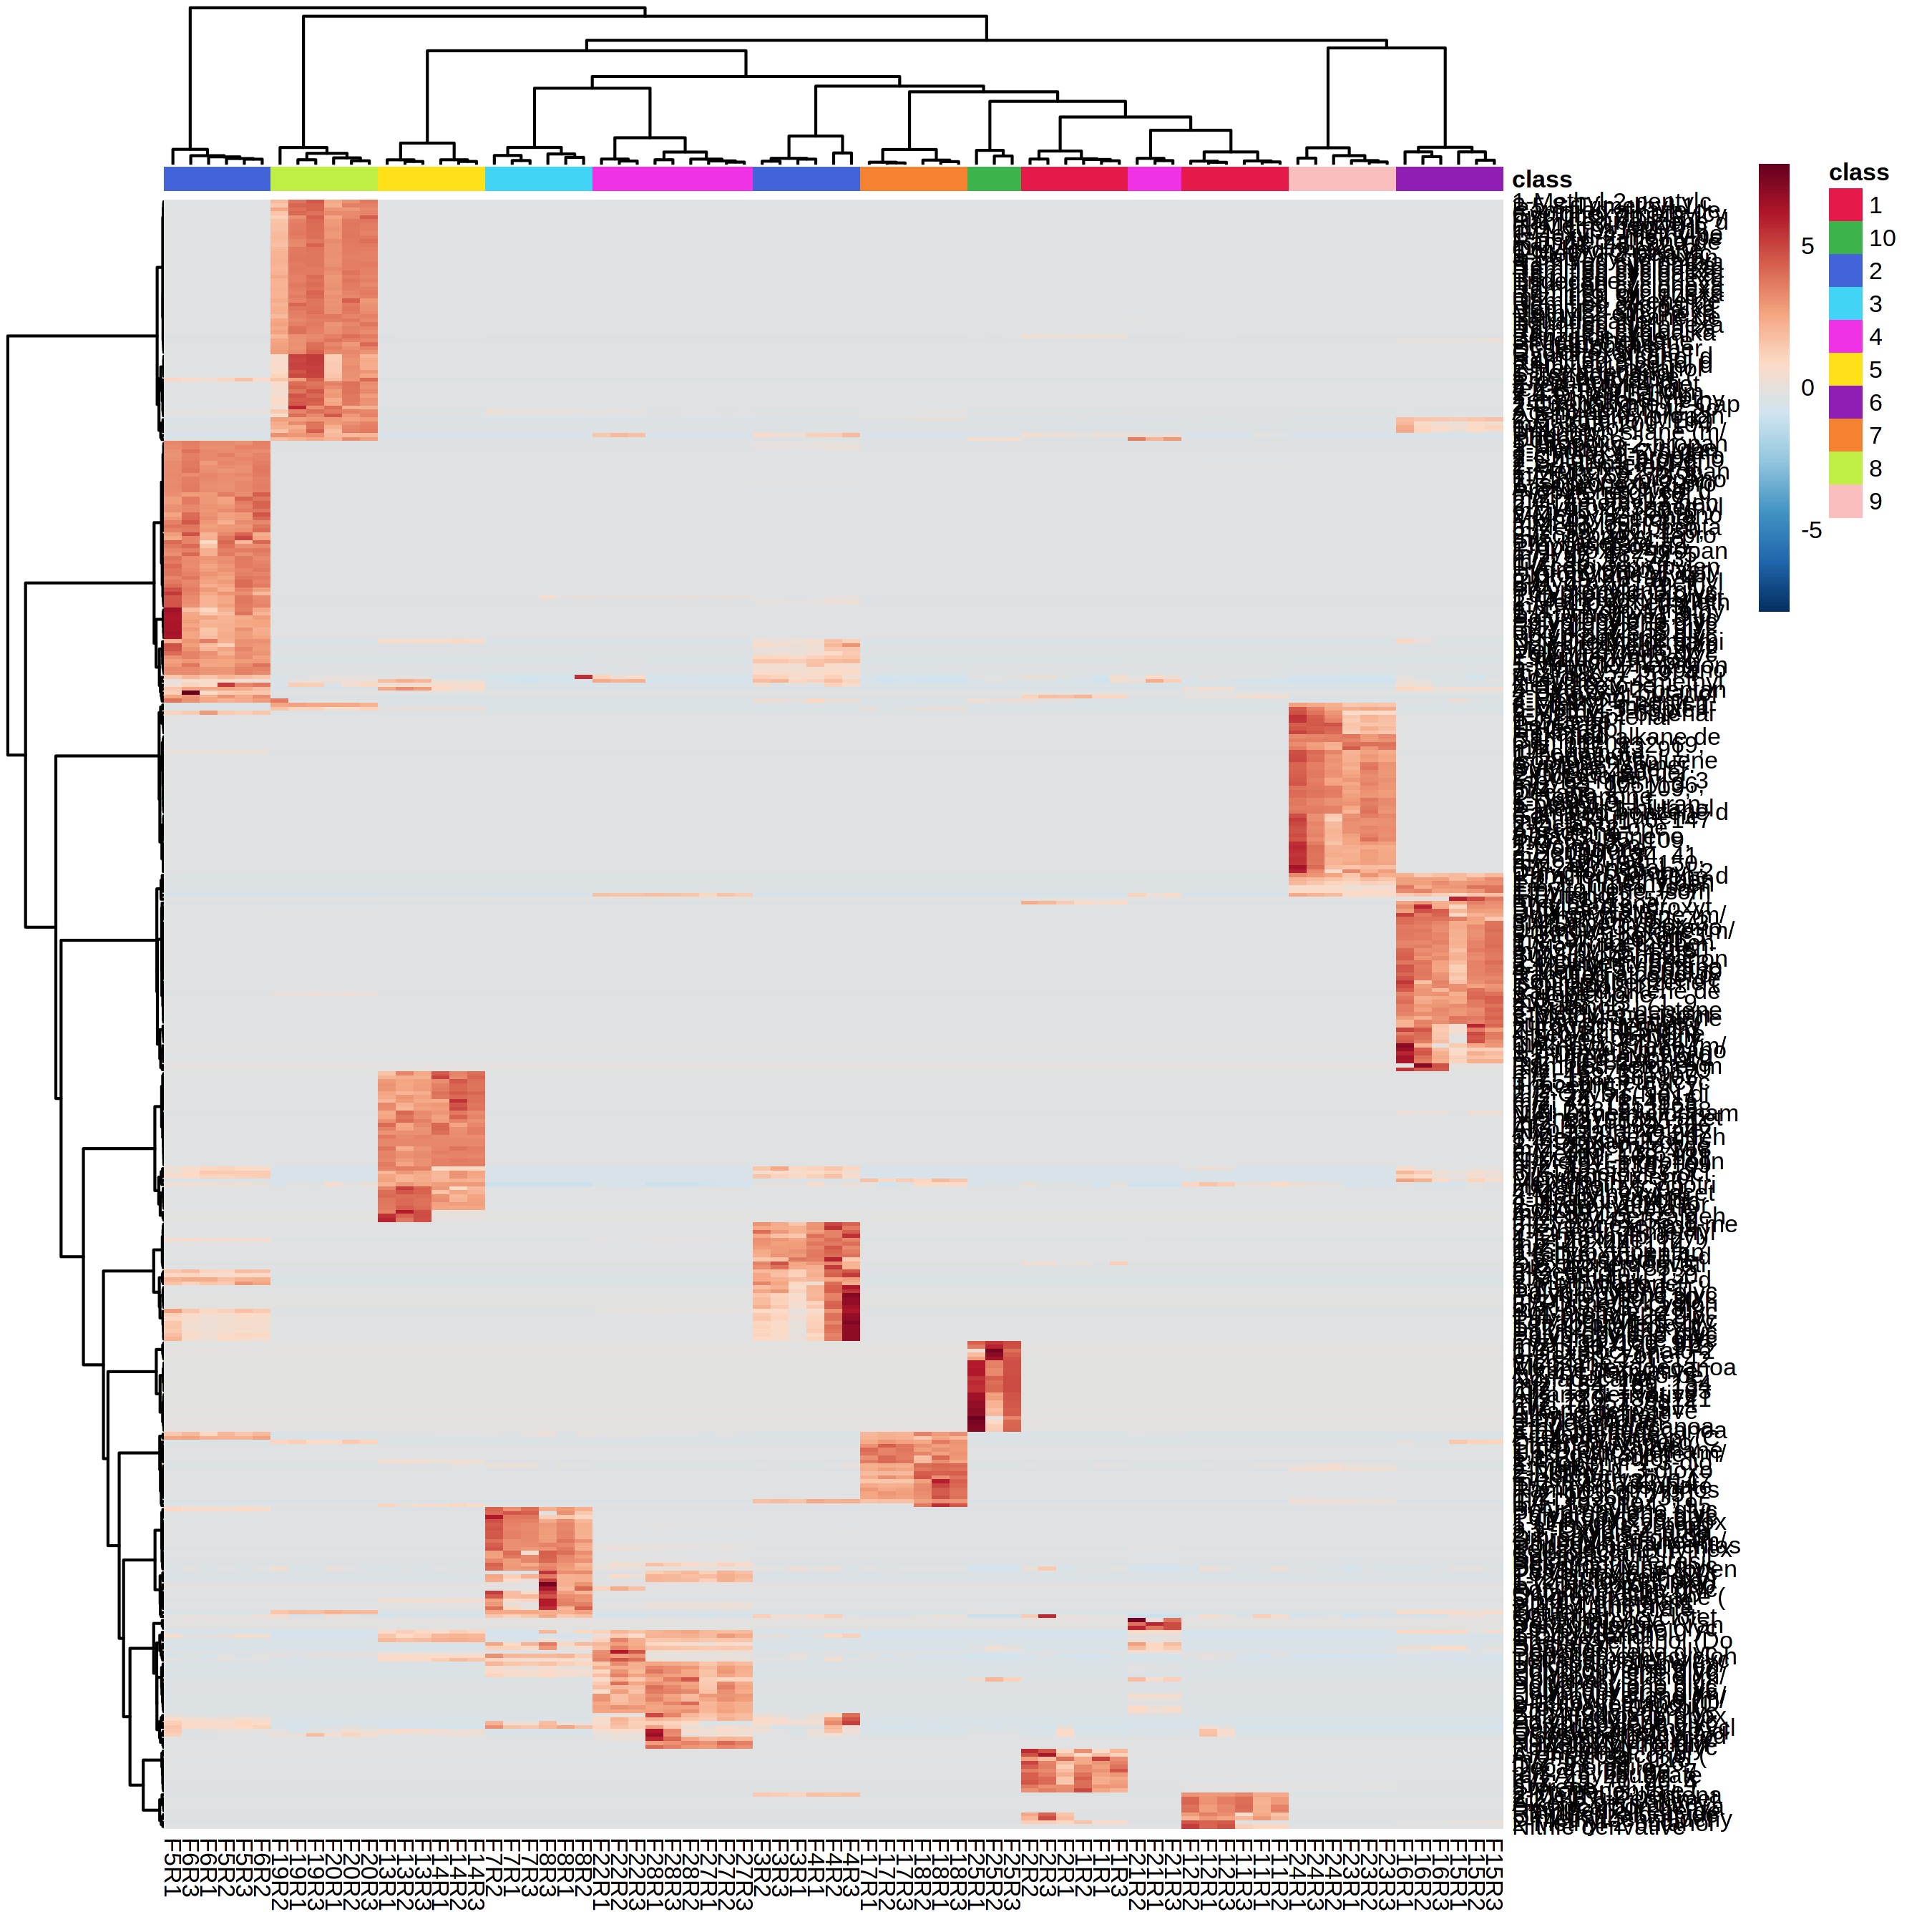
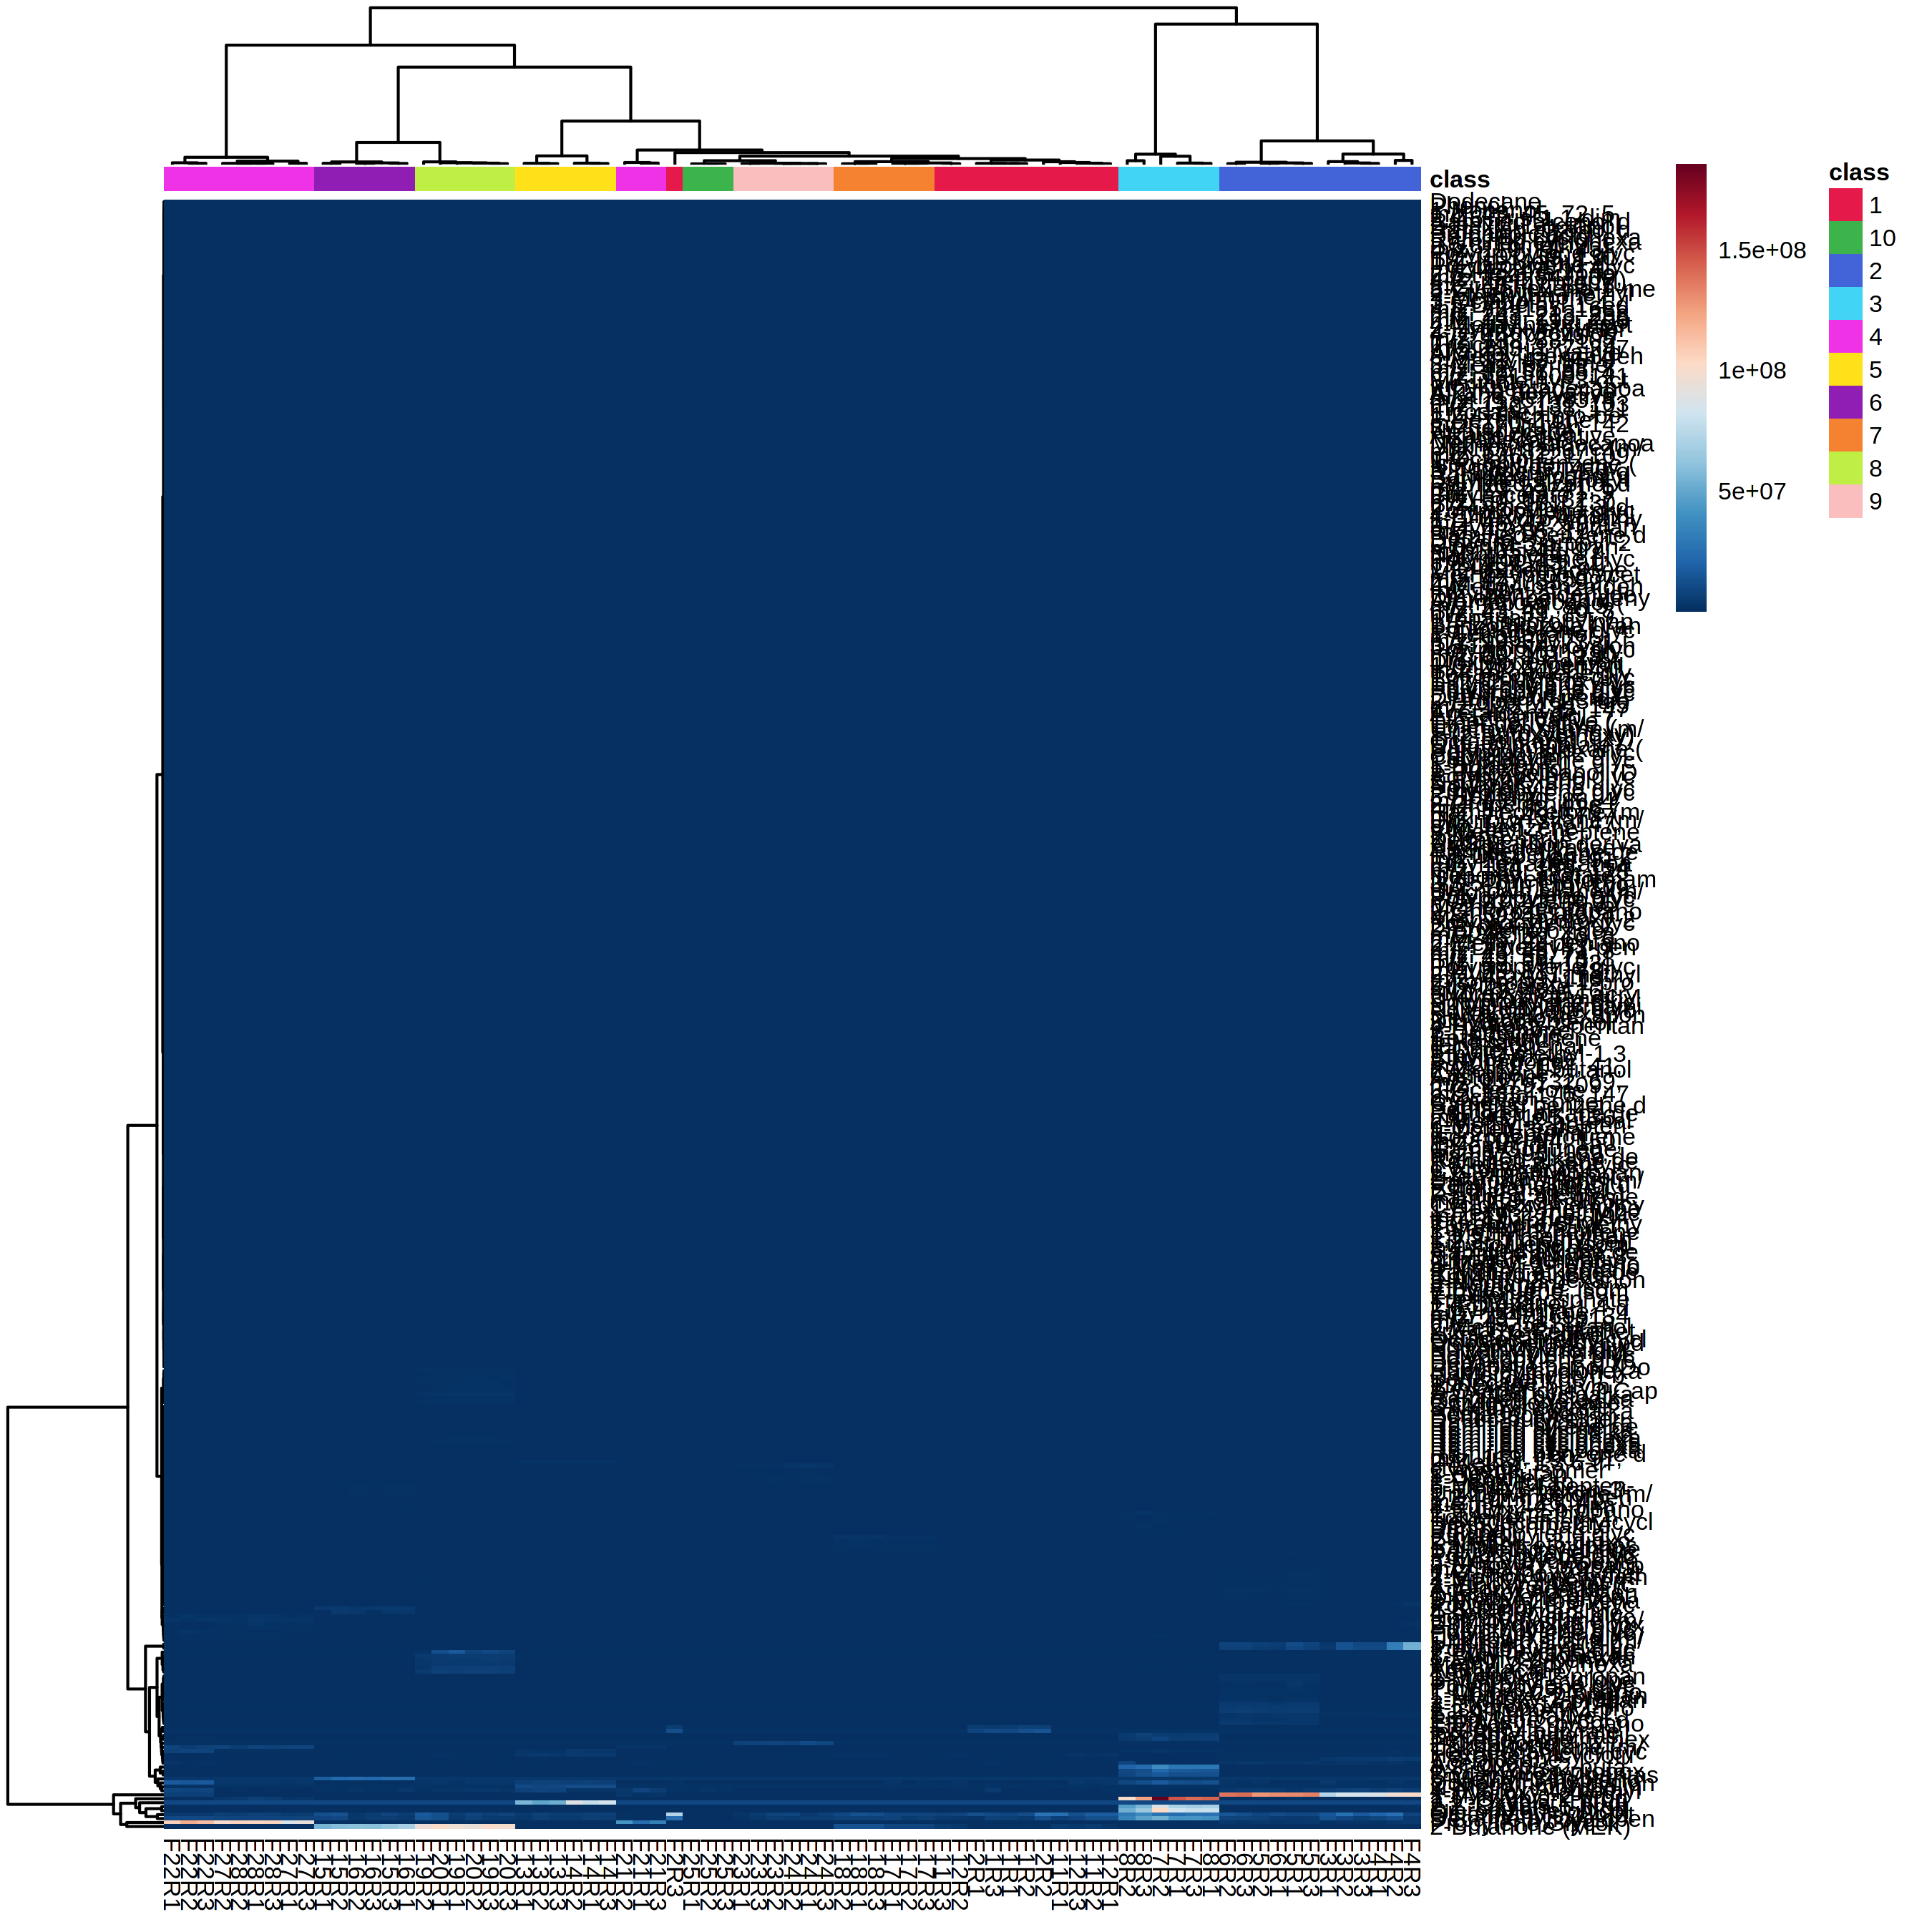
As I upload my file and get to the Heatmap section (data type: peak area; data filtering: none; normalization: autoscaling), I notice there is no minimum value visible anywhere (dark blue as standard). Also, since I have a lot of absolute zeros in my file, that would mean (correct me if I am wrong) that my Heatmap would be painted in blue tones rather than gray tones:
I understand your question is that you cannot visually view the pixel representing the minimum value, right? This is because the minimal value is quite rare and highly possible burried by other pixels.
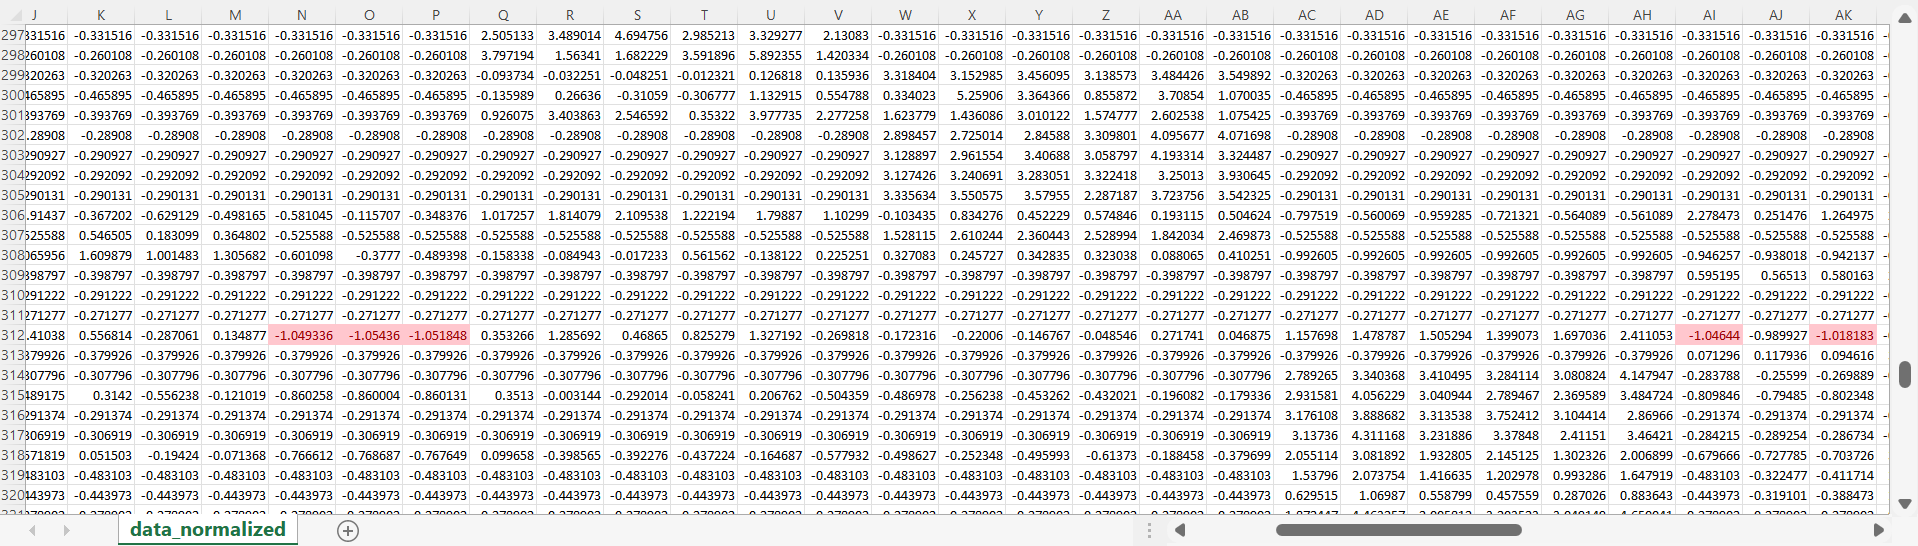
At first I thought about that too, but even in detailed view I could not spot dark blues. So, I downloaded the .csv document with the normalized data and I could only find 5 values under -1 (and the chromatic scale goes beyond -5):