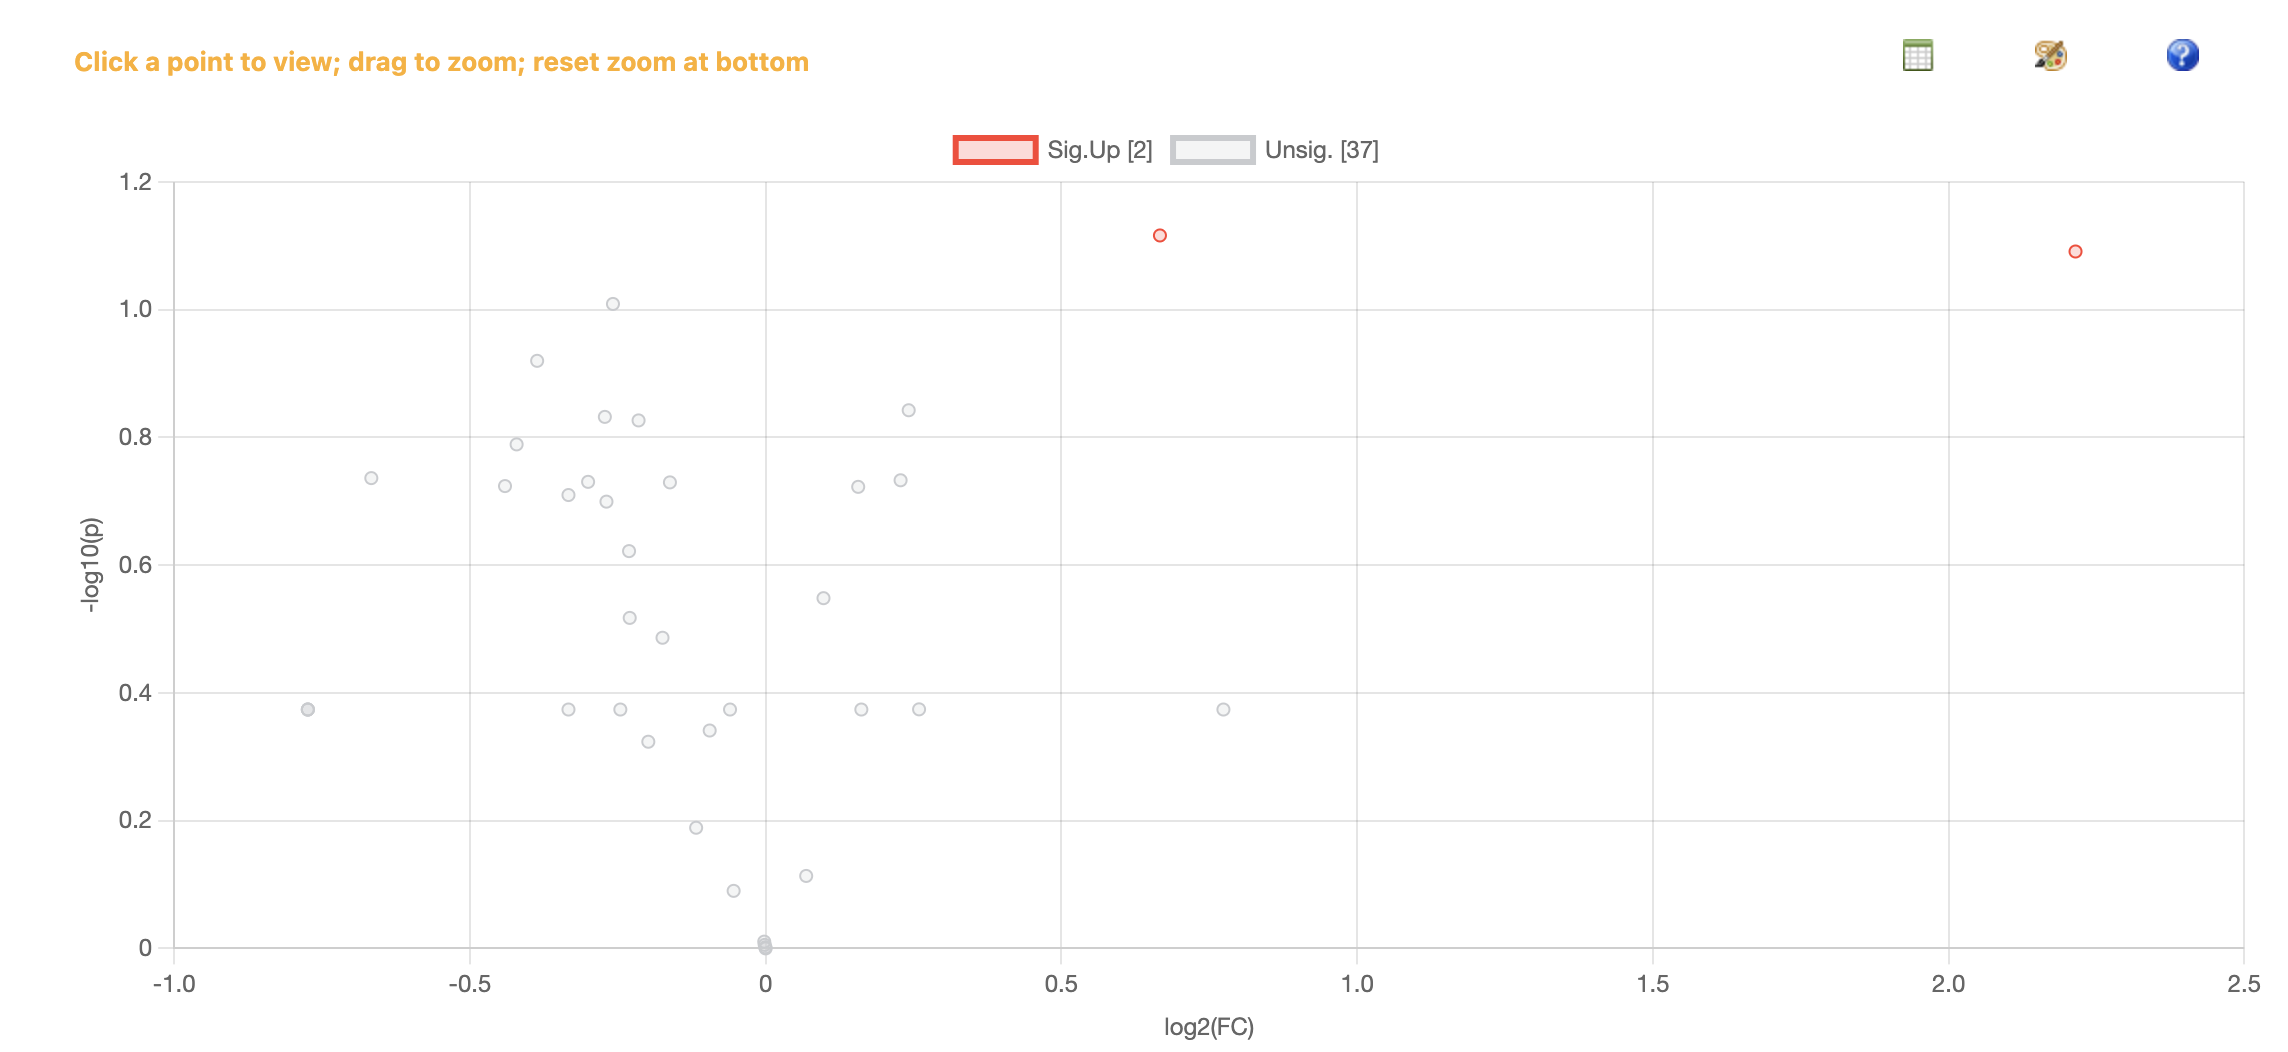
Uploaded data on MetaboAnalyst 6.0 browser for paired statistical analysis (one factor, samples in colums, paired, peak intensities) of lipidomic results on a Mac (Sonoma 14.5). No issues with upload or any output but the Volcano. The report is there, I can download the csv file from the download section, and I can see the actual interactive vulcano (see image). But i cannot download the figure (see images). I have deleted cookies and cache from the browsing story.
Provide a copy of your data (the actual data file, not a screenshot image of the data), or indicate which example data you used Uploaded
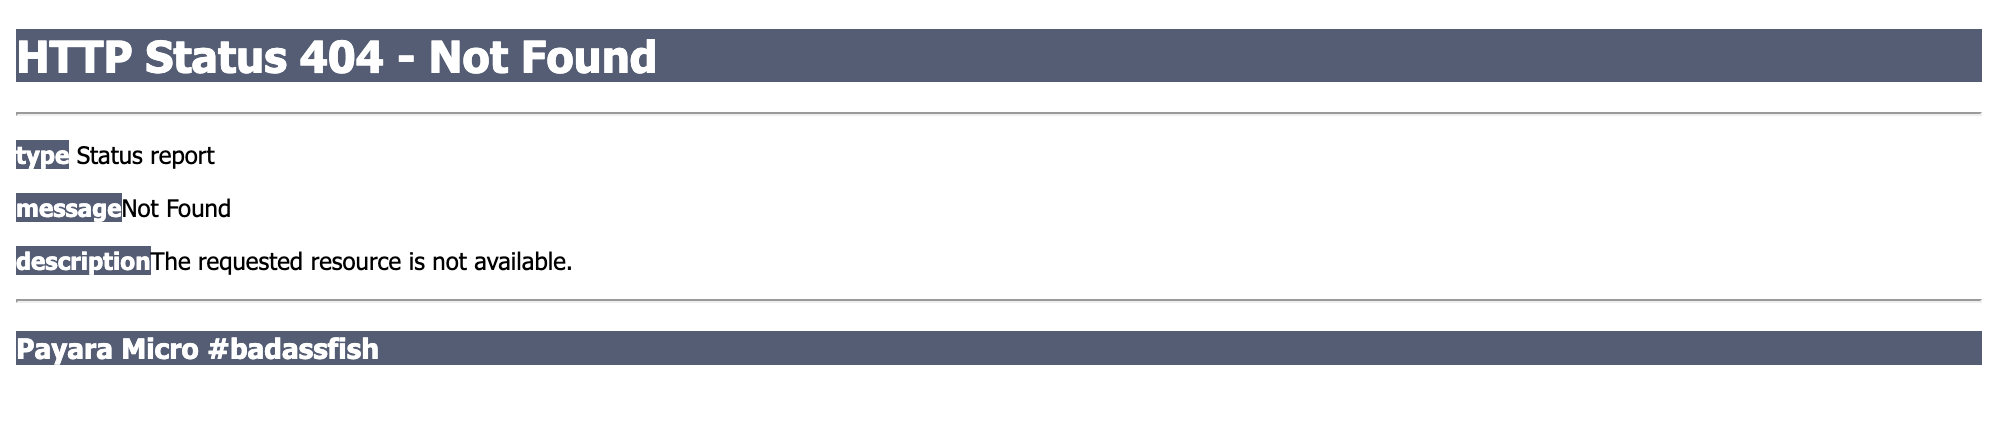
Document all steps leading to the issue. Sometimes screenshots may be necessary - Metaboanalyst/Statistical analysis (one factor) - Peak intensities/samples in columns (paired)/choole file/submit - Proceed - Proceed - Sample normalization: none/ Data transformation: Log transformation (base 10)/ Data scaling: Pareto scaling/ Normalize/ Proceed - Volcano - Paired/ minimal/ all significant/ FC 1.5/ Direction 1/0 / pVal 0.1 Raw/ Submit - Customize the data output/ PNG 300dpi 12 inches/ submit - Download the image/ HTTP Status 404 - Not Found
If it is about using R packages, you also need to provide the environment information, such as N/A
If it is about raw data processing, please also describe how the data were collected (instrumentation, etc). N/A
If your questions are not answered, it is probably because we don’t know how to reproduce the issue, or we don’t have time to guess all possible scenarios. I hope the issue now clear. The problem is only with downloading the actual plots and table of result, not with seeing them on the screen. Thanks. MetaboUPLOAD.csv (1.8 KB)
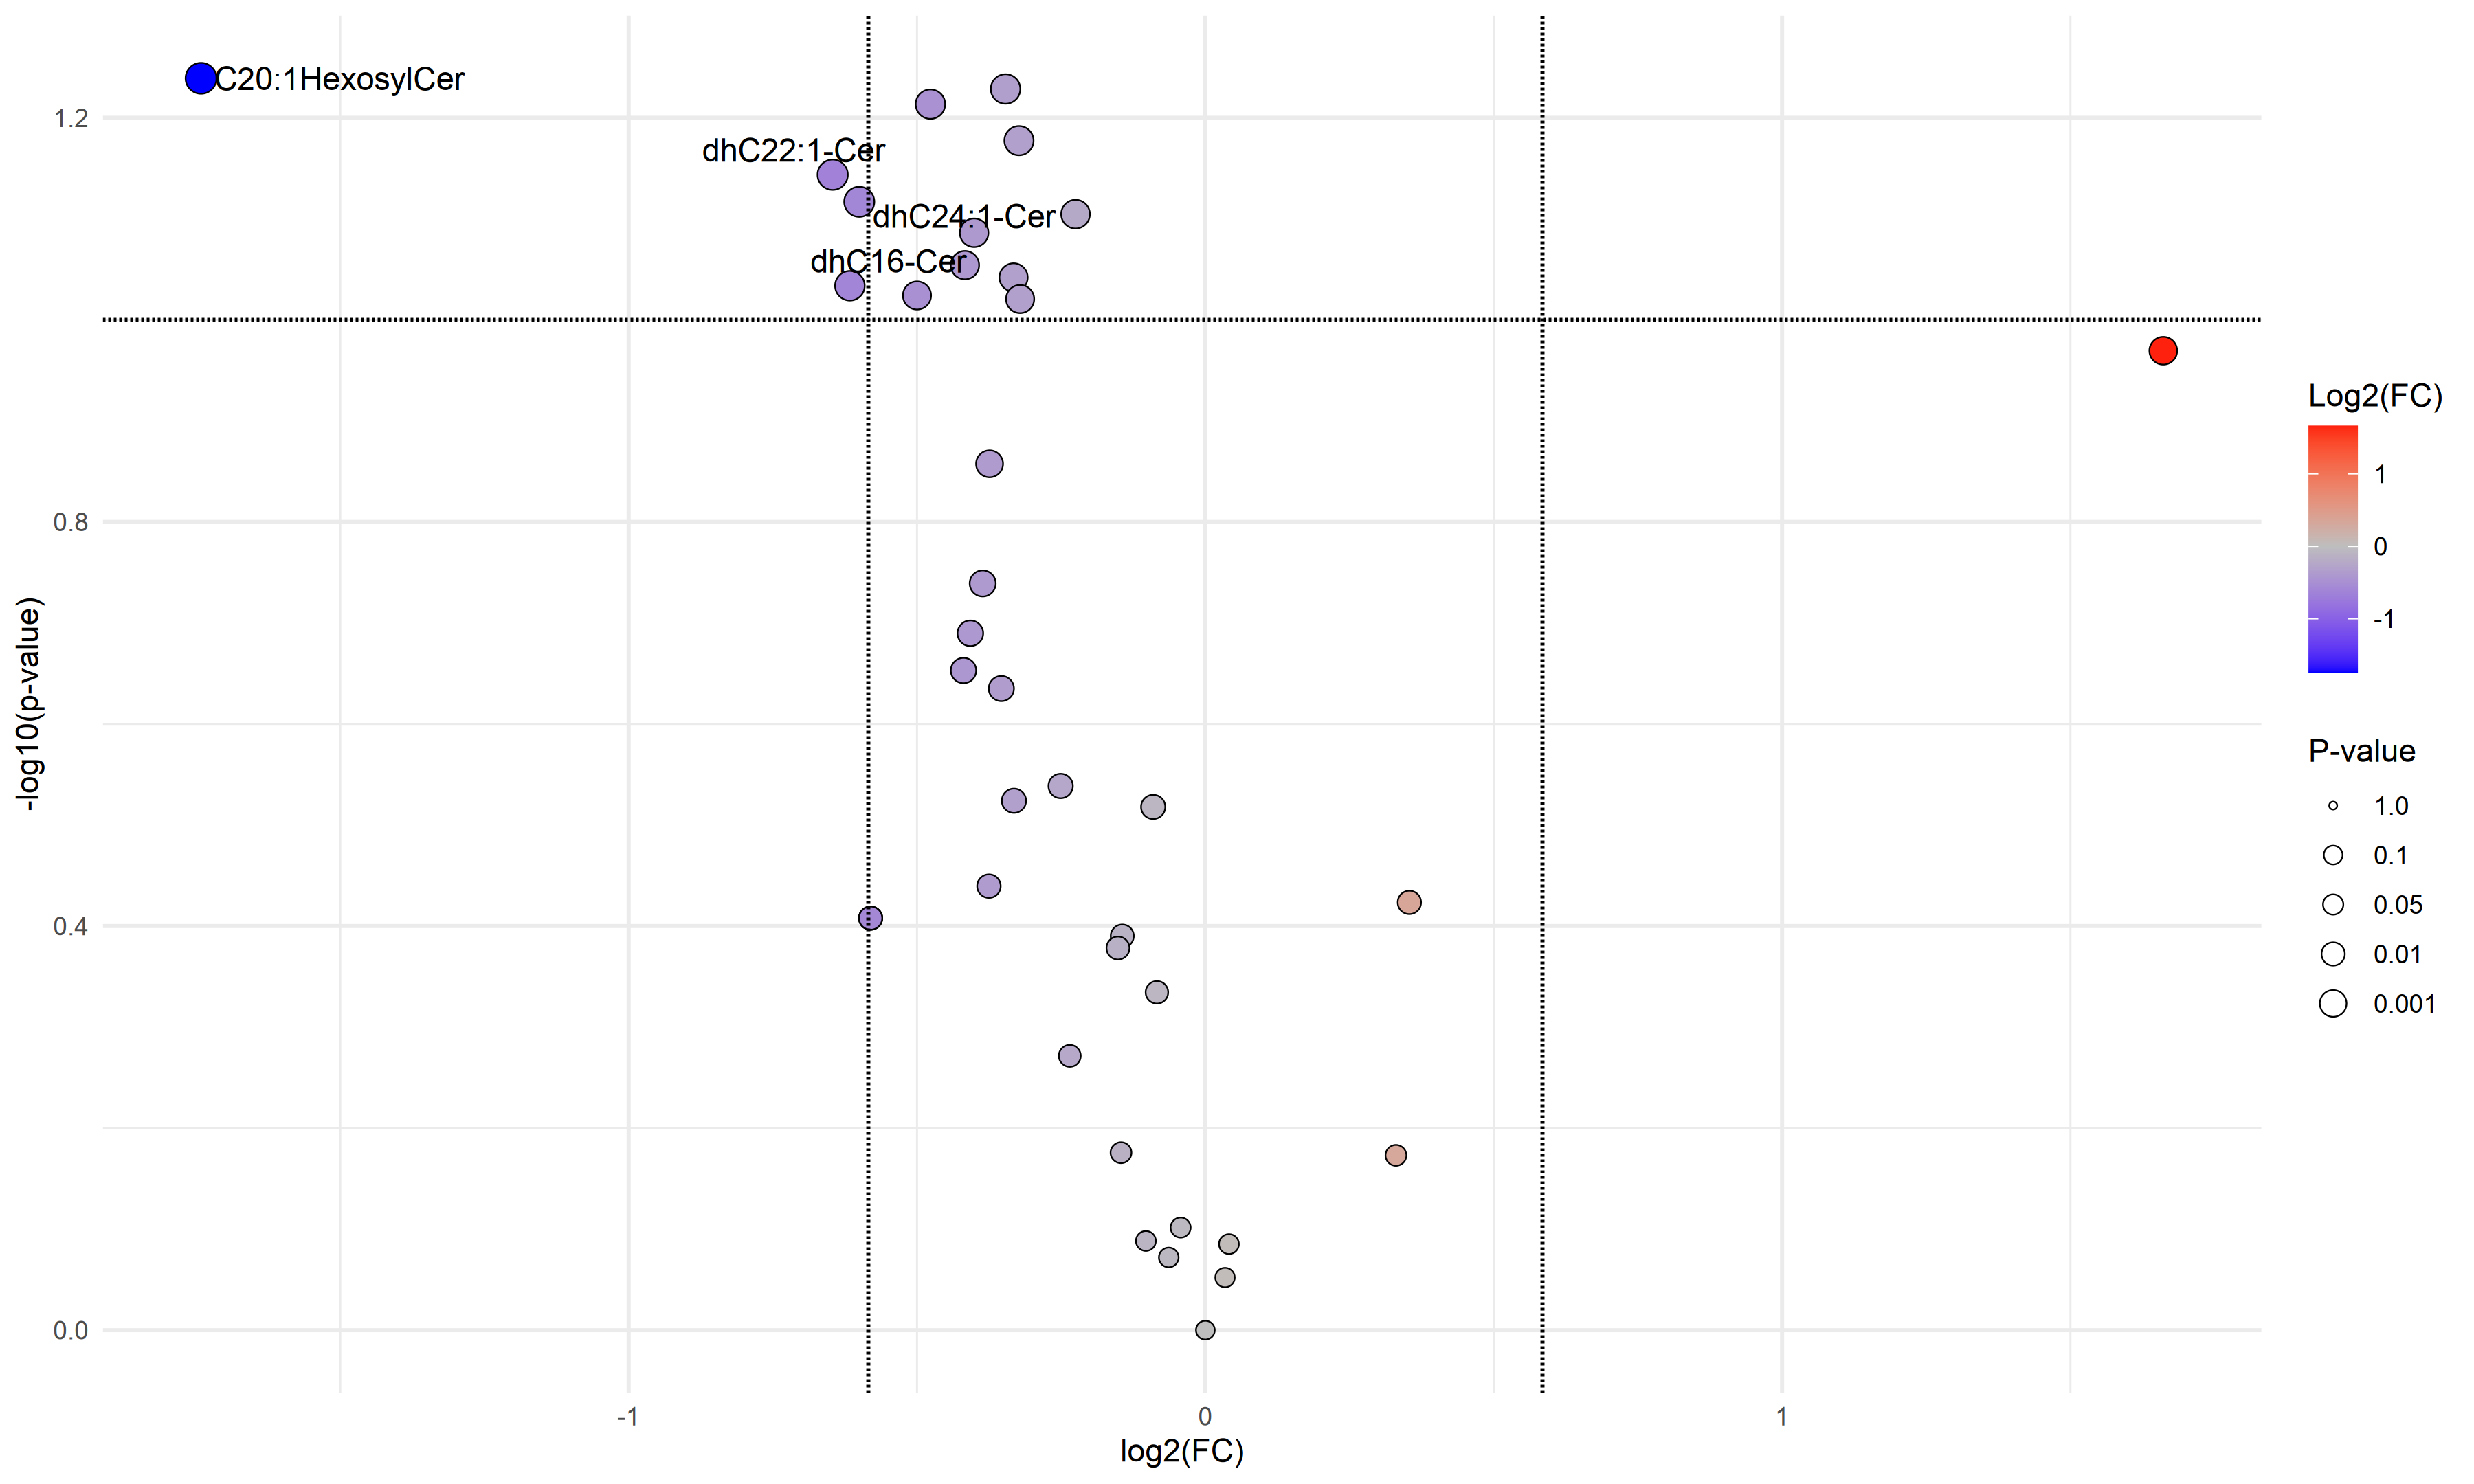
Thank you for the details. I did not notice any issues based on the steps. It generated the graphics as expected for downloading. However, the volcano plot is different from your screenshot (see below).
I can see the issue is related to one of your features (see below) - which has identical values in each group, violating t-test model assumption (i.e. normal)
You can
Remove this feature and perform analsis as before
Keep this feature and perform analysis using non-parametric method (i.e. use the checkbox in the Volcano plot)
Wait for the next update (in 2~3 days) - which will first perform regular t-tests. For those failed t-tests, perform non-parametric tests (i.e. Wilcoxon signed-rank test)