Error with PlotHeatMap and PlotCorrHeatMap function

Hello, I am reporting two errors that happen on MetaboAnalyst R 4.0 when using the example data.
Error 1
My code:

“# Perform hierarchical clustering and plot heat map###”
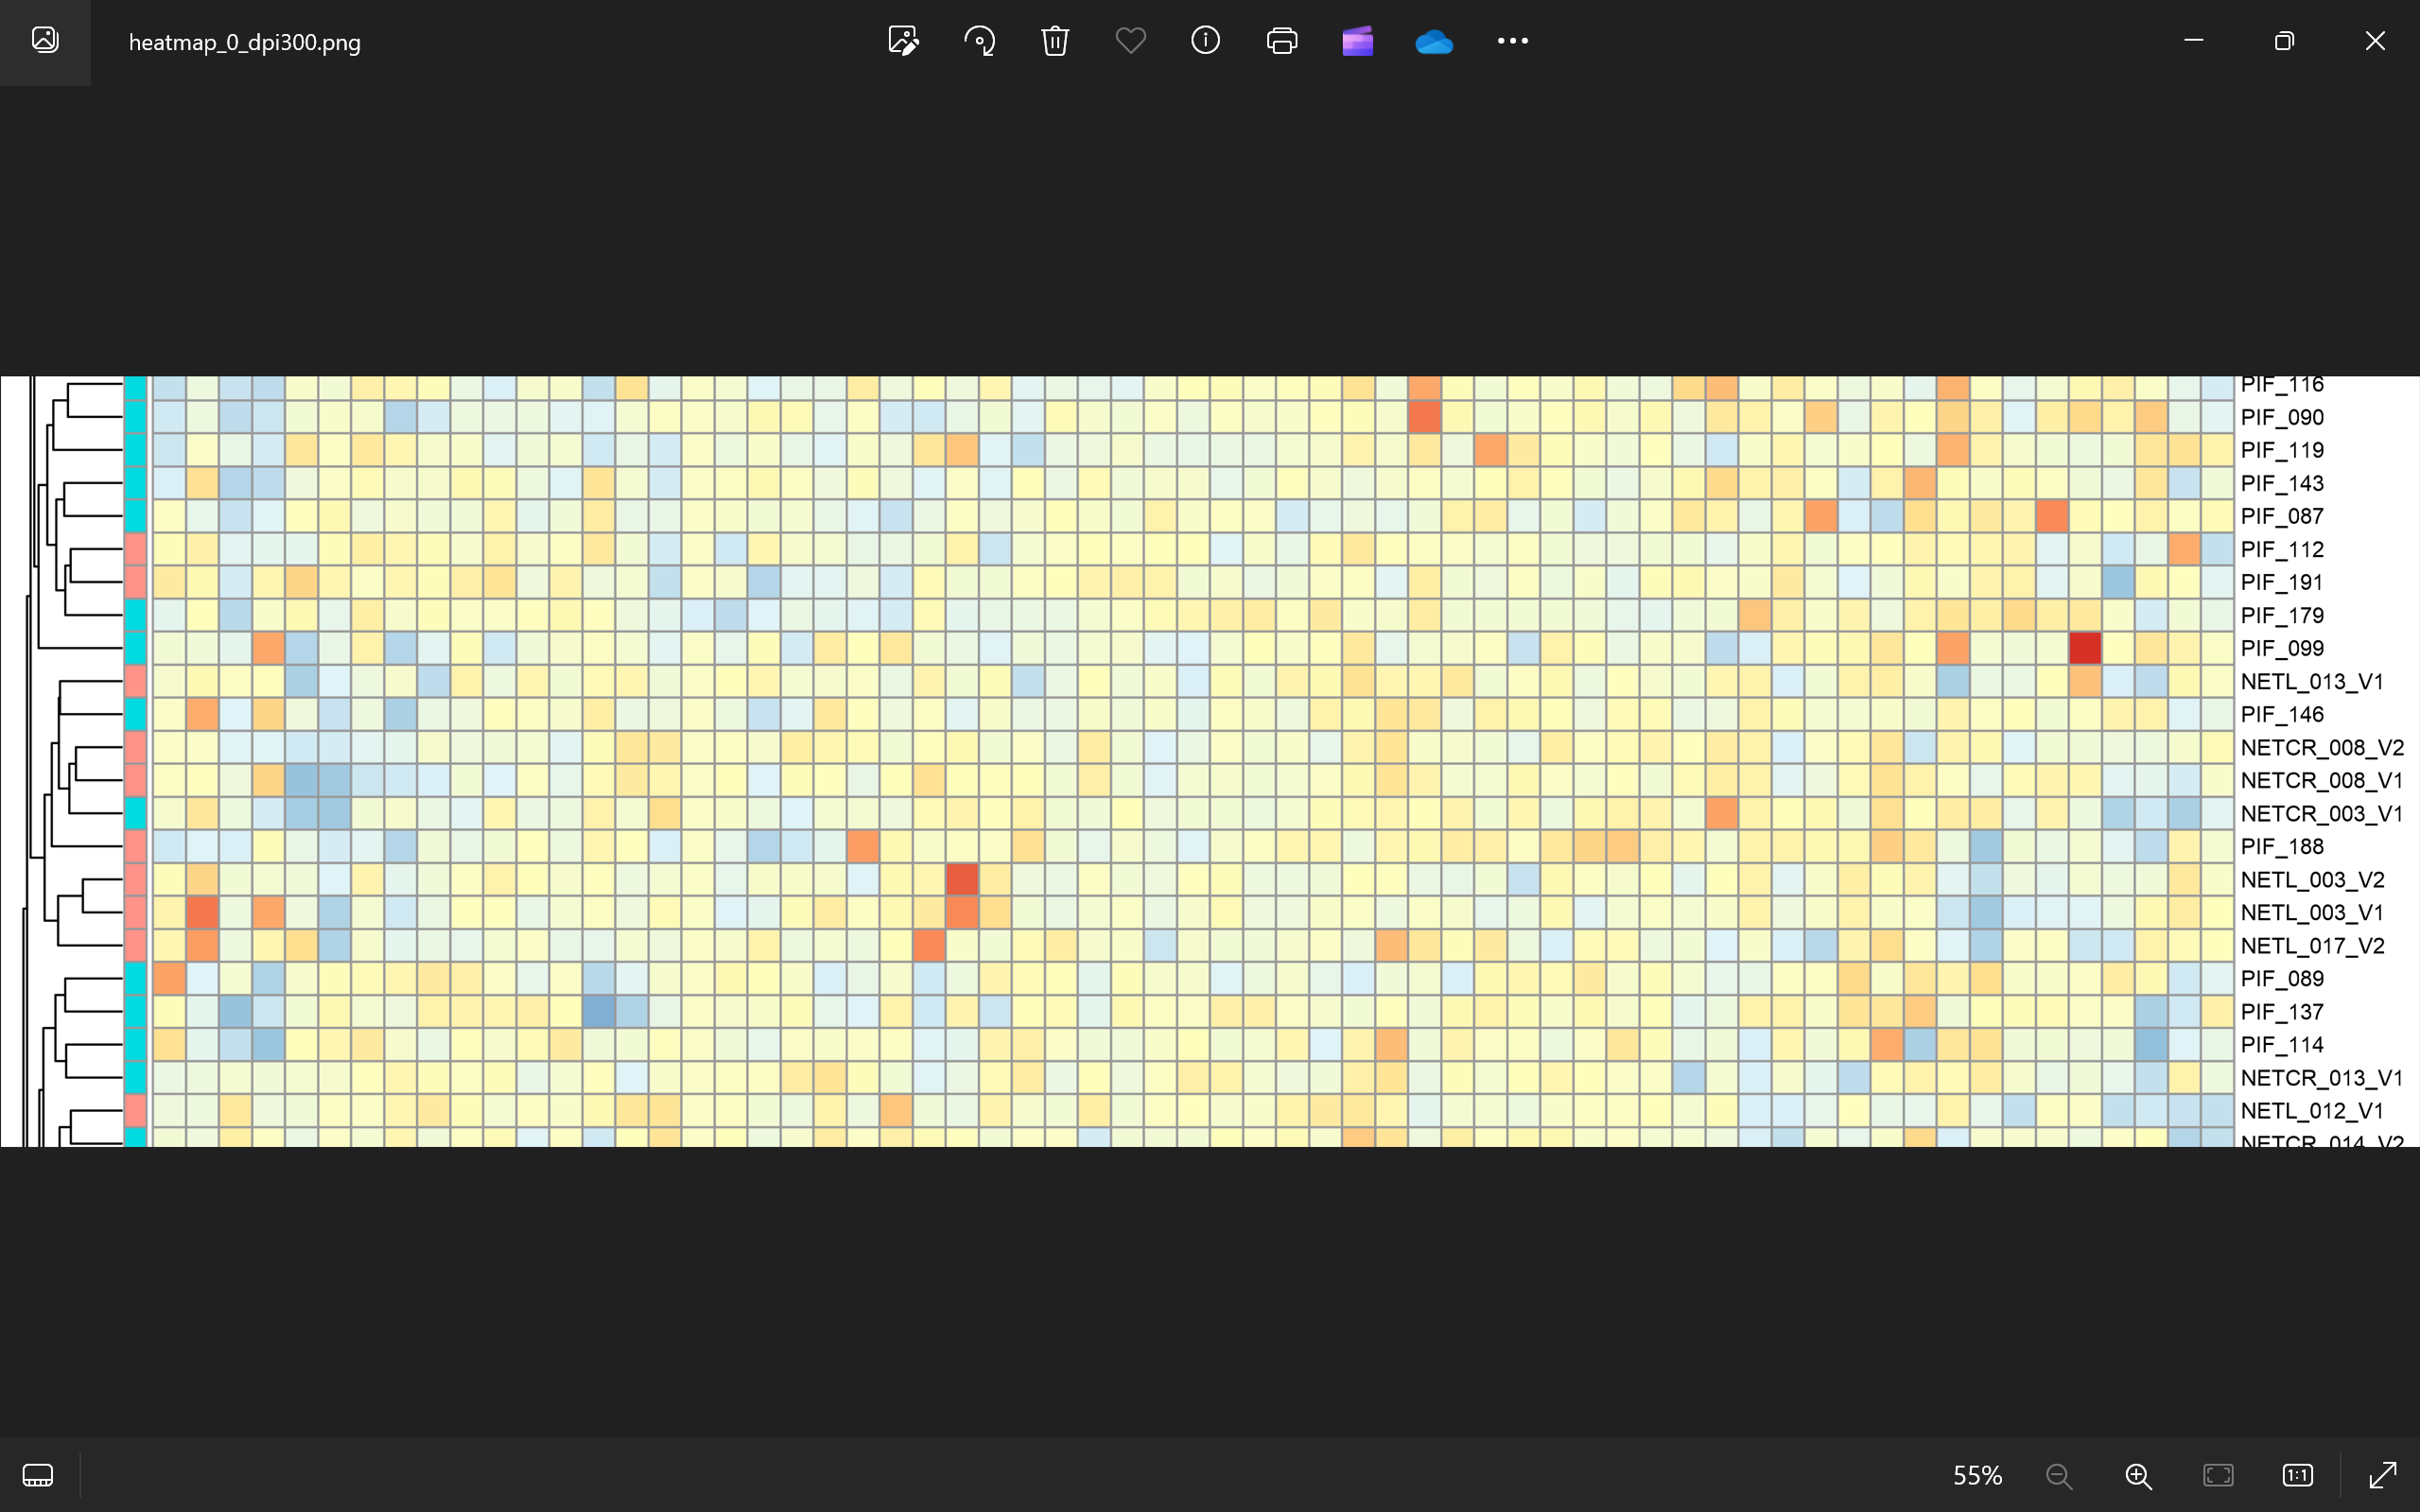
mSet<-PlotHeatMap(mSet, “heatmap_0_”, “png”, 72, width=NA, “norm”, “row”, “euclidean”, “ward.D”,“bwm”, 8, “overview”, T, T, NULL, T, F, T, T, T)

My output:

[1] “heatmap_0_.json”

Only two new files (“heatmap_stats.rds”, and “heatmap_0_json”) were created, no figure can be found.

Error 2
My code:

#2.5 Correlation Analysis - using Heatmap”
“### OPTION 1) - Heatmap specifying pearson distance and an overview###”
mSet<-PlotCorrHeatMap(mSet, “corr_0_”, format = “png”, dpi = 300, width=NA, “col”, “pearson”, “bwm”, “overview”, F, F, 0.0)

“### OPTION 2) - Heatmap specifying pearson correlation and a detailed view###”
mSet<-PlotCorrHeatMap(mSet, “corr_1_”, format = “png”, dpi=300, width=NA, “col”, “spearman”, “bwm”, “detail”, F, F, 999)

After executing these two lines of code,I obtain the same following error:

Error in if (fix.col) { : argument is not interpretable as logical

Could you please help?

For using MetaboAnalystR package, the corresponding functions should be updated:
PlotHeatMap => PlotStaticHeatMap
PlotCorrHeatMap => PlotStaticCorrHeatMap

Thank you for your guideline. The code runs well in the Correlation Analysis after changing PlotCorrHeatMap to PlotStaticCorrHeatMap.
However, anothor error exists when running the example file to perform Hierarchical Clustering.

My code:

Perform hierarchical clustering and plot heat map

mSet<-PlotStaticHeatMap(mSet, “heatmap_0_”, “png”, 300, width=NA, “norm”, “row”, “euclidean”, “ward.D”,“bwm”, 8, “overview”, T, T, NULL, T, F, T, T, T)

The console:

mSet<-PlotStaticHeatMap(mSet, “heatmap_0_”, “png”, 300, width=NA, “norm”, “row”, “euclidean”, “ward.D”,“bwm”, 8, “overview”, T, T, NULL, T, F, T, T, T)
Error in (class(cluster_rows) == “hclust”) || cluster_rows :
invalid ‘y’ type in ‘x || y’

Thanks again for your help.

And it output a figure that seems like part iof the heatmap.
Could you help with the error? Thank you

There is a missing parameter in the your R command.

PlotStaticHeatMap(mSet, “heatmap_1_”, “png”, 300, width=NA, “norm”, “row”, “euclidean”, “ward.D”,“bwm”, 8, 8, “overview”, T, T, NULL, T, F, T, T, T)

This topic was automatically closed 12 hours after the last reply. New replies are no longer allowed.