Dear MetaboAnalyst Support/Community,
I am encountering an unexpected behavior with the Joint Pathway Analysis module in MetaboAnalyst and would appreciate some clarification.
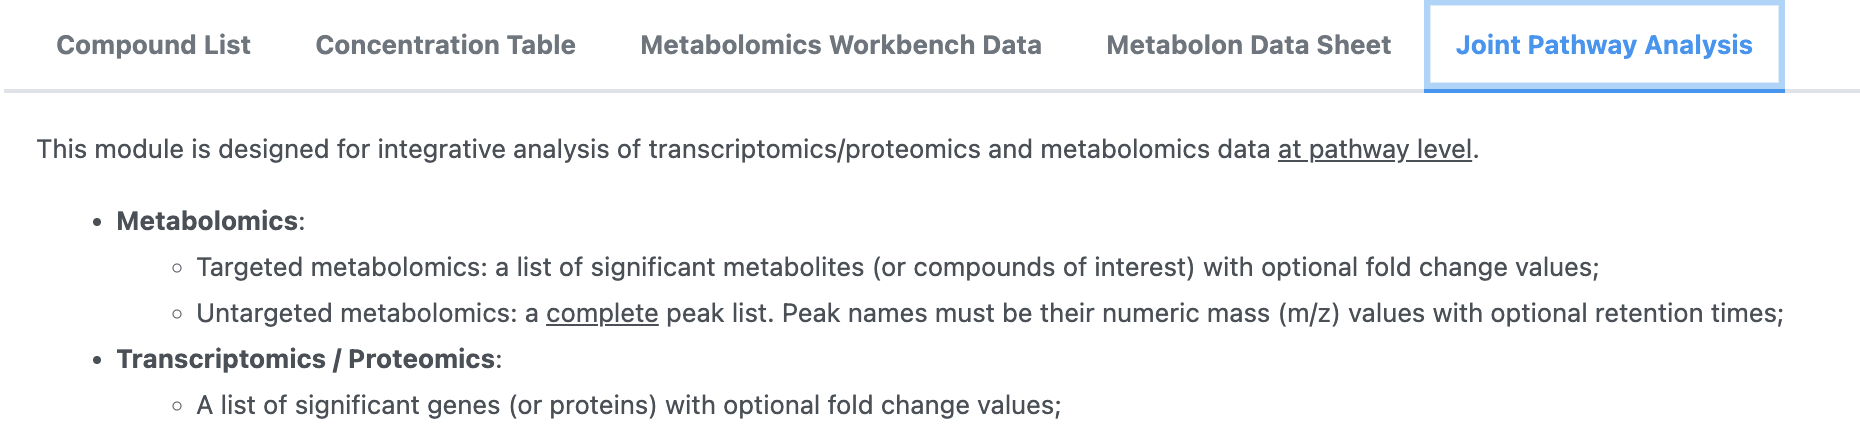
In July 2025, I performed a joint pathway analysis by uploading a list of HMDB IDs and gene names, each accompanied by their respective loading values. My understanding was that providing these loading values would facilitate an enrichment analysis, which takes into account the magnitude of change or importance of each feature.
However, when I re-ran the exact same input data today (March 2026), I observed a significant divergence in the results compared to July 2025. More critically, I also noticed that uploading only HMDB IDs and gene names (without any associated loading values), which I understand should typically lead to an over-representation analysis, yields results identical to those obtained when loading values are included.
To further investigate this, I tested the example dataset “A multiomics study of COVID-19 (covid vs. healthy) from Ariel et al. This data includes 1,659 DE genes and 19 DE metabolites”. I ran this example once with its provided fold change values and once again after removing those values. In both instances, the results were consistently the same, further suggesting that the loading/fold change values are not currently influencing the analysis as expected for an enrichment approach.
This behavior suggests that the presence or absence of loading values might not be differentiating between enrichment and over-representation analyses as I anticipated, or as it might have in previous versions/runs.
Could you please provide insight into:
- Whether there have been any recent updates or changes to the Joint Pathway Analysis algorithm that would explain this discrepancy?
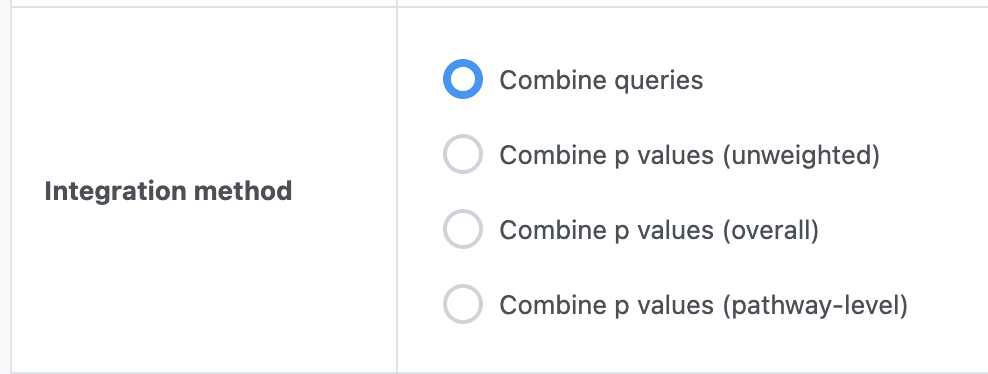
- How MetaboAnalyst currently differentiates between enrichment analysis (with quantitative values) and over-representation analysis (without quantitative values) within the joint pathway module
- Any potential user error on my part that could lead to this observation?
Thank you for your time and assistance!