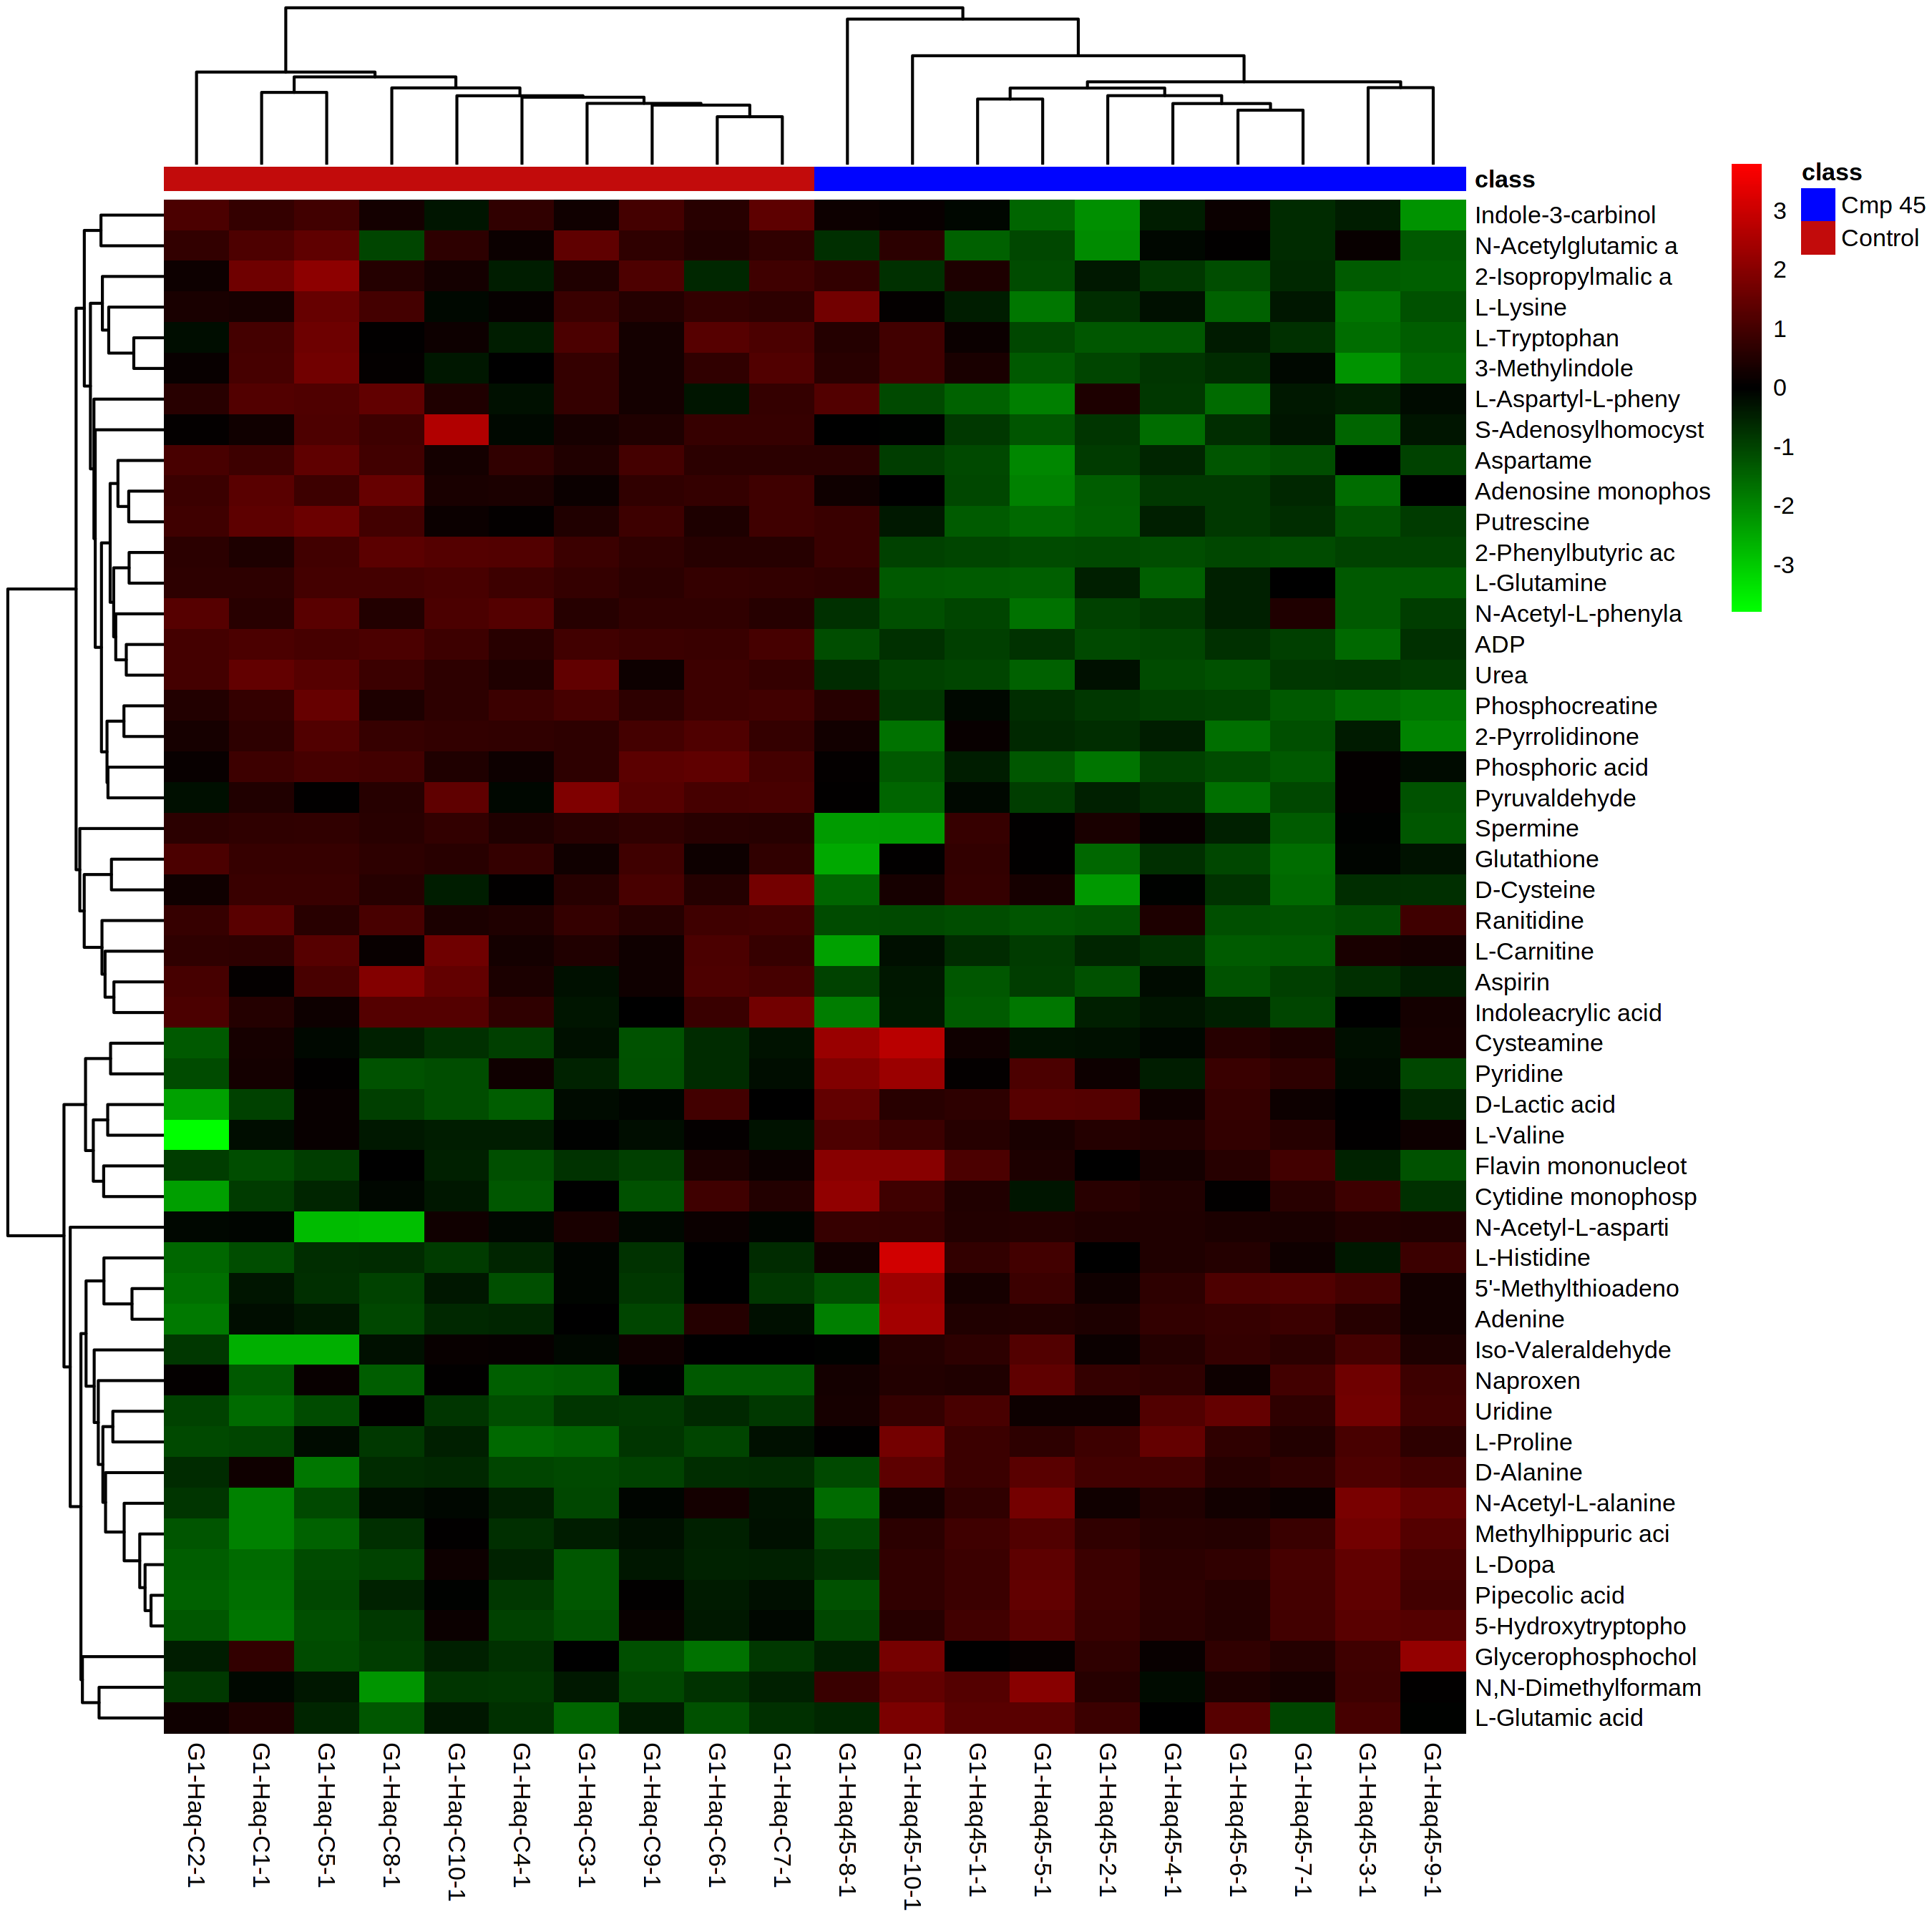
I’ve created a heatmap for metabolomics data using the default parameter in metaboanalyst and choosing top 40 metabolites based on T-test/ANOVA.
What does the color scale mean? Green and red? Does it refer to increased and decreased metabolites? How is this related to Z score? How can we explain the change in the colour intensity of metabolites among samples
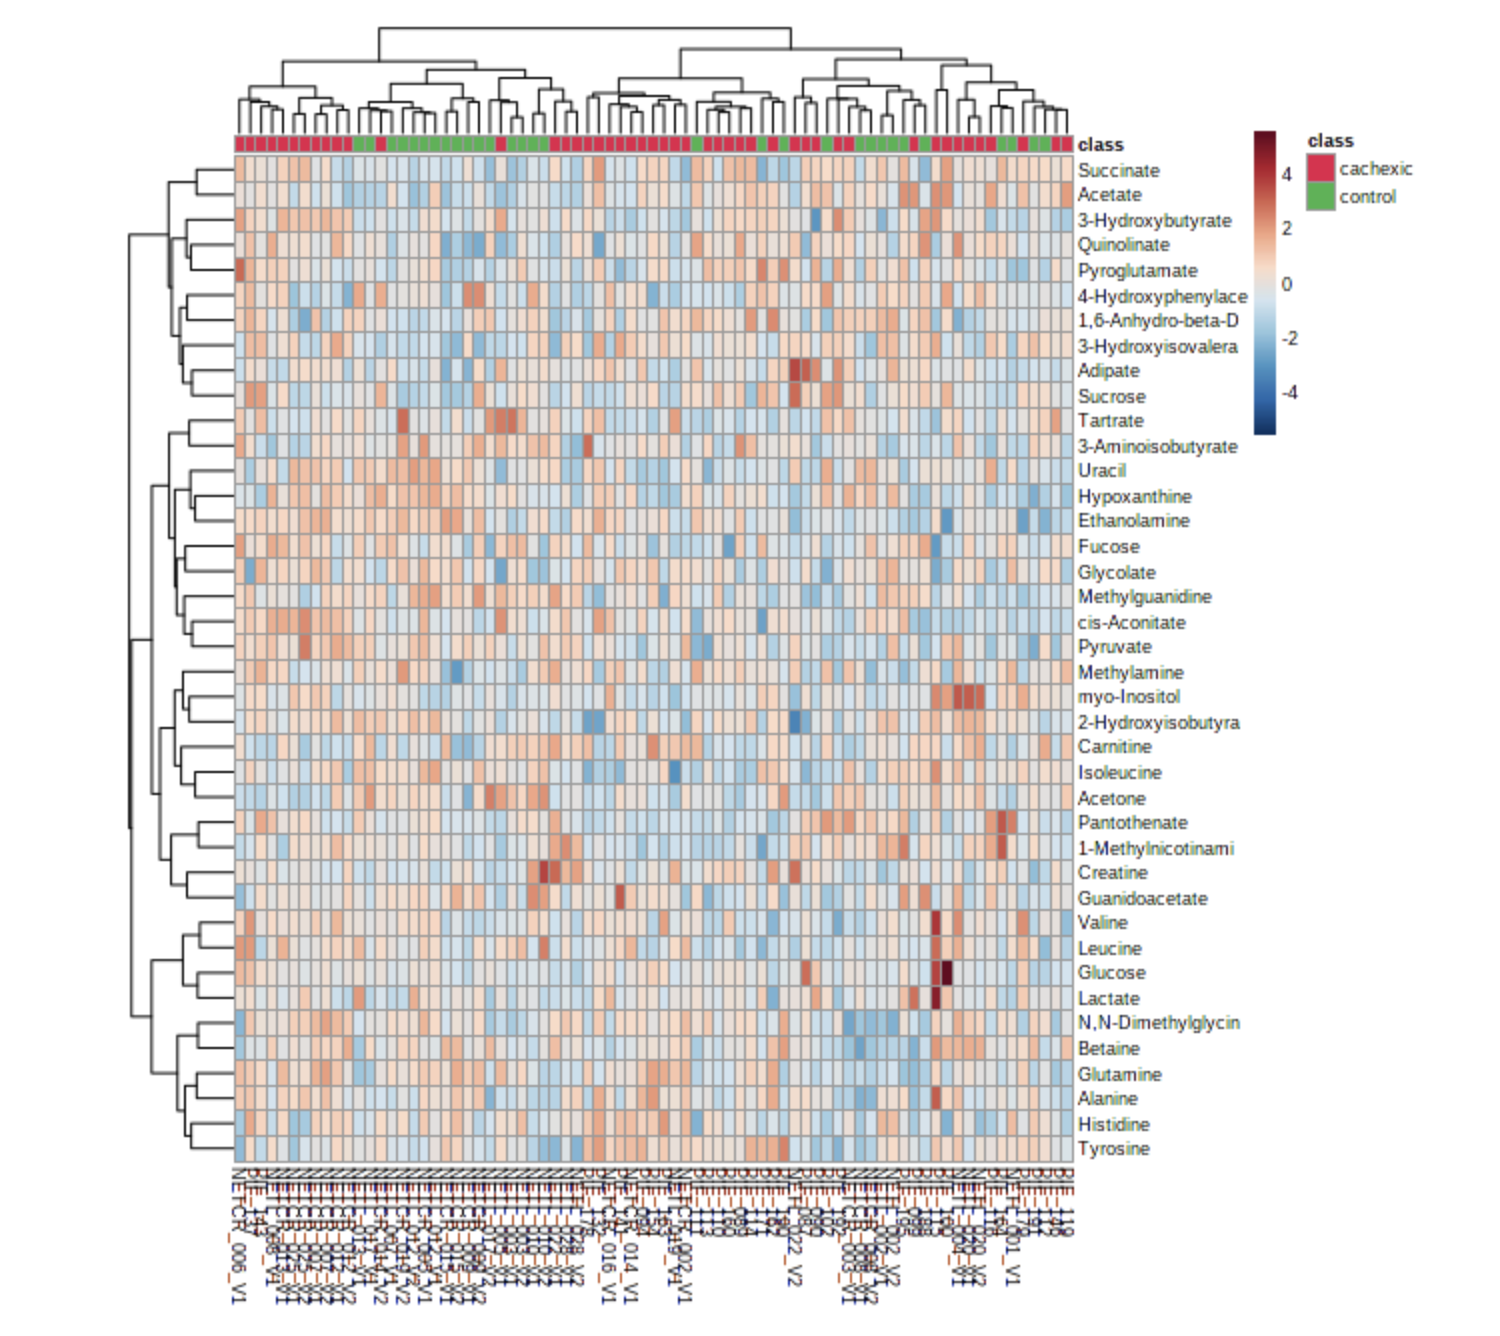
I’m not sure exactly what you are asking (it’s difficult to tell since you haven’t given specific steps/screenshots). Assuming you have used the ‘Heatmap’ tool in the ‘Statistics [single factor]’ module, you would get a heatmap like this:
Here, the red/green correspond to the class labels of each sample, according to the legend. The default settings above are ‘Autoscale features’ for the ‘Standardization’ parameter. This means that each metabolite has been autoscaled/z-transformed (they all mean the same thing), thus each cell displays the feature-wise z-score. To calculate z-score: subtract mean and divide by standard deviation. This means that higher values reflect higher metabolite abundance, lower values reflect lower abundance.
So dose the green cell reflect lower metabolite abundance and the red higher abundance?Are the number in the color scale to the right (-3, -2, -1, 0, 1, 2, 3) reflect Z score?
Thanks