Peak Annotation step generated peak groups which contain isotopes, adduct ions and other unknown peaks that could belong to the same peak group. However, in the downstream analysis it seems we did not use these information to reduce the peak list. I think one of the main purposes for peak annotation is to shorten the peak list. I was wondering when and how to use these information properly. Should we get rid of the isotope peaks, combine adduct peaks or combine all the peak intensity belong to the same peak group? Thank you.
Hi Julia,
Thanks for this question. Yes, the annotation results of the entire feature table include both isotops and adducts information. This annotation is performed with CAMERA package. Based on their manual (Bioconductor - CAMERA), I didnot see a clear guidance on how to process these annotation results further. However, I do have some ideas on how to remove the redundancy:
-
For isotopes, their intensity (or abundance) is expectedly much lower than their parent features (M+0). It is safe to remove the isotopes (M+1, M+2, etc), because the low intensity features are usually more variant (more deviation included) due to the base noise of the MS instrument. Unless users’ researches are specifically focusing on the characteristics of isotopic features.
-
For adducts, this depends on cases of specific features.
- If intensities these adducts features are much lower (e.g. 90%) than their parent feature, it is better to remove the adducts but keep their parent feature;
- Similar to the point above, if the intensity these adducts features are much higher than their parent feature, it is better to remove the parent feature but keep the adduct feature;
- If intensities these adducts features are same or similar as their parent features, it is better to keep both of them for further investigation;
- An important situation is that if there are more than one annotations results (e.g. annotated as one isotope + one adduct or as multiple different adducts) for one feature, it is challenging to make a decision in this case unless there is more experimental proof;
- In addition, mathematically merge the intensity (abundance) of the adduct and parent features seems obvious but also quite arbitary, because of the lack of evidence showing additivity of MS signals (from different m/z regions).
In summary, the annotation results can be used to show the relationshipe between MS features and reduce the redundancy to some extent.
1 Like
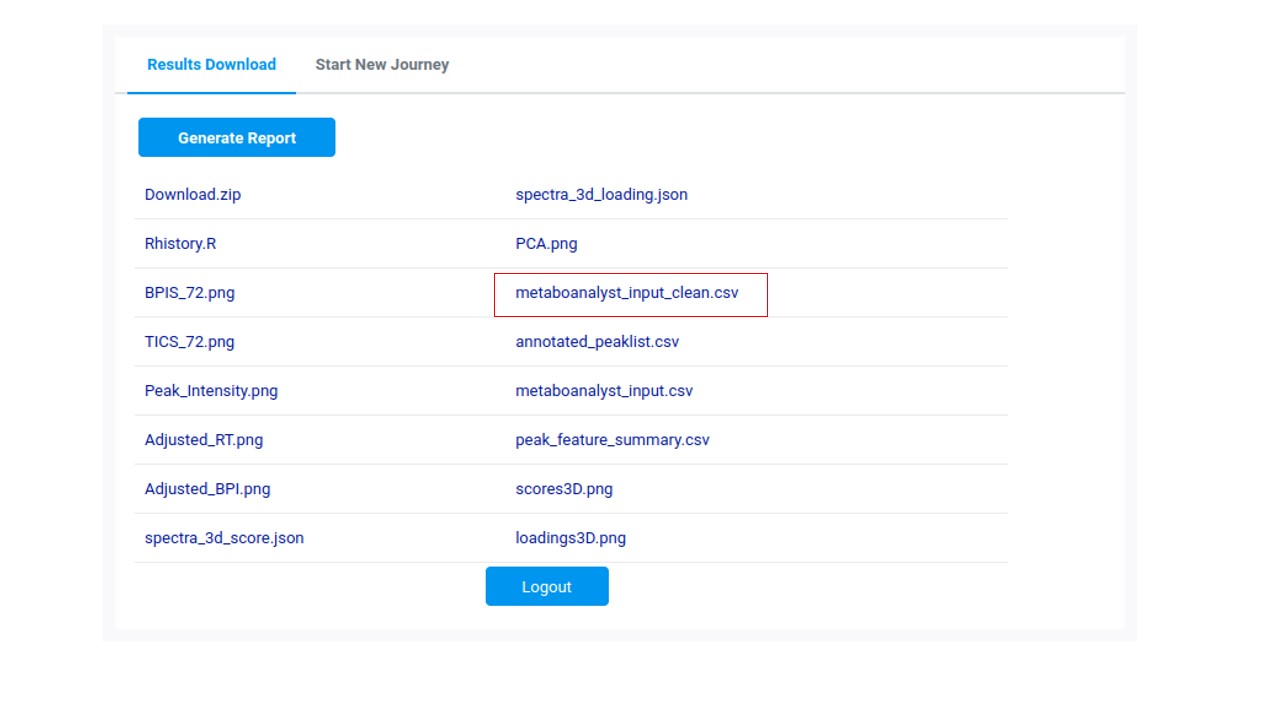
One more thing, currently, MetaboAnalyst supports doing a basic feature filteration based on the annotation results. All primary (De)protonated ions will be kept based on the annotation results. The redundancy-free feature table is available from the Download Page (metaboanalyst_input_clean.csv).
1 Like
Qiang,
Thanks a lot for the detailed explanation. I fully agree on what you suggested. To recap, you would suggest remove isotopes (unless the study needs the info). Also we could remove features in the peak group which have low intensity and showed great variability. In terms of variability, should we estimate it after correcting batch effects and data normalization? I assume batch effects will create great variability.
I wish metaboAnalyst can provide more sophisticated filtering options but your explanation here gave good guidelines. Thank you.
Yes. The variability of features truly deserves a specific concern. It is better to evaluate the variability based on some QC samples or other standard reference samples. But, as you said, the batch effect (and even signal drift) is the major source of variation, which needs first attention. Thanks for your advice, MetaboAnalyst will provide more mathmatically appropriate options for user to reduce the redundancy. This has been in my TODO list ![]() .
.