Dose response analysis is conducted at multiple concentrations of a chemical. Metabolomics data are measured in each sample, and a suite of non-linear curves are fit to the levels of each metablomics feature. The best fitted curve is analyzed to compute a feature-level benchmark dose (BMD), which is the minimum concentration of a substance that produces a clear, low level health risk relative to the control group.
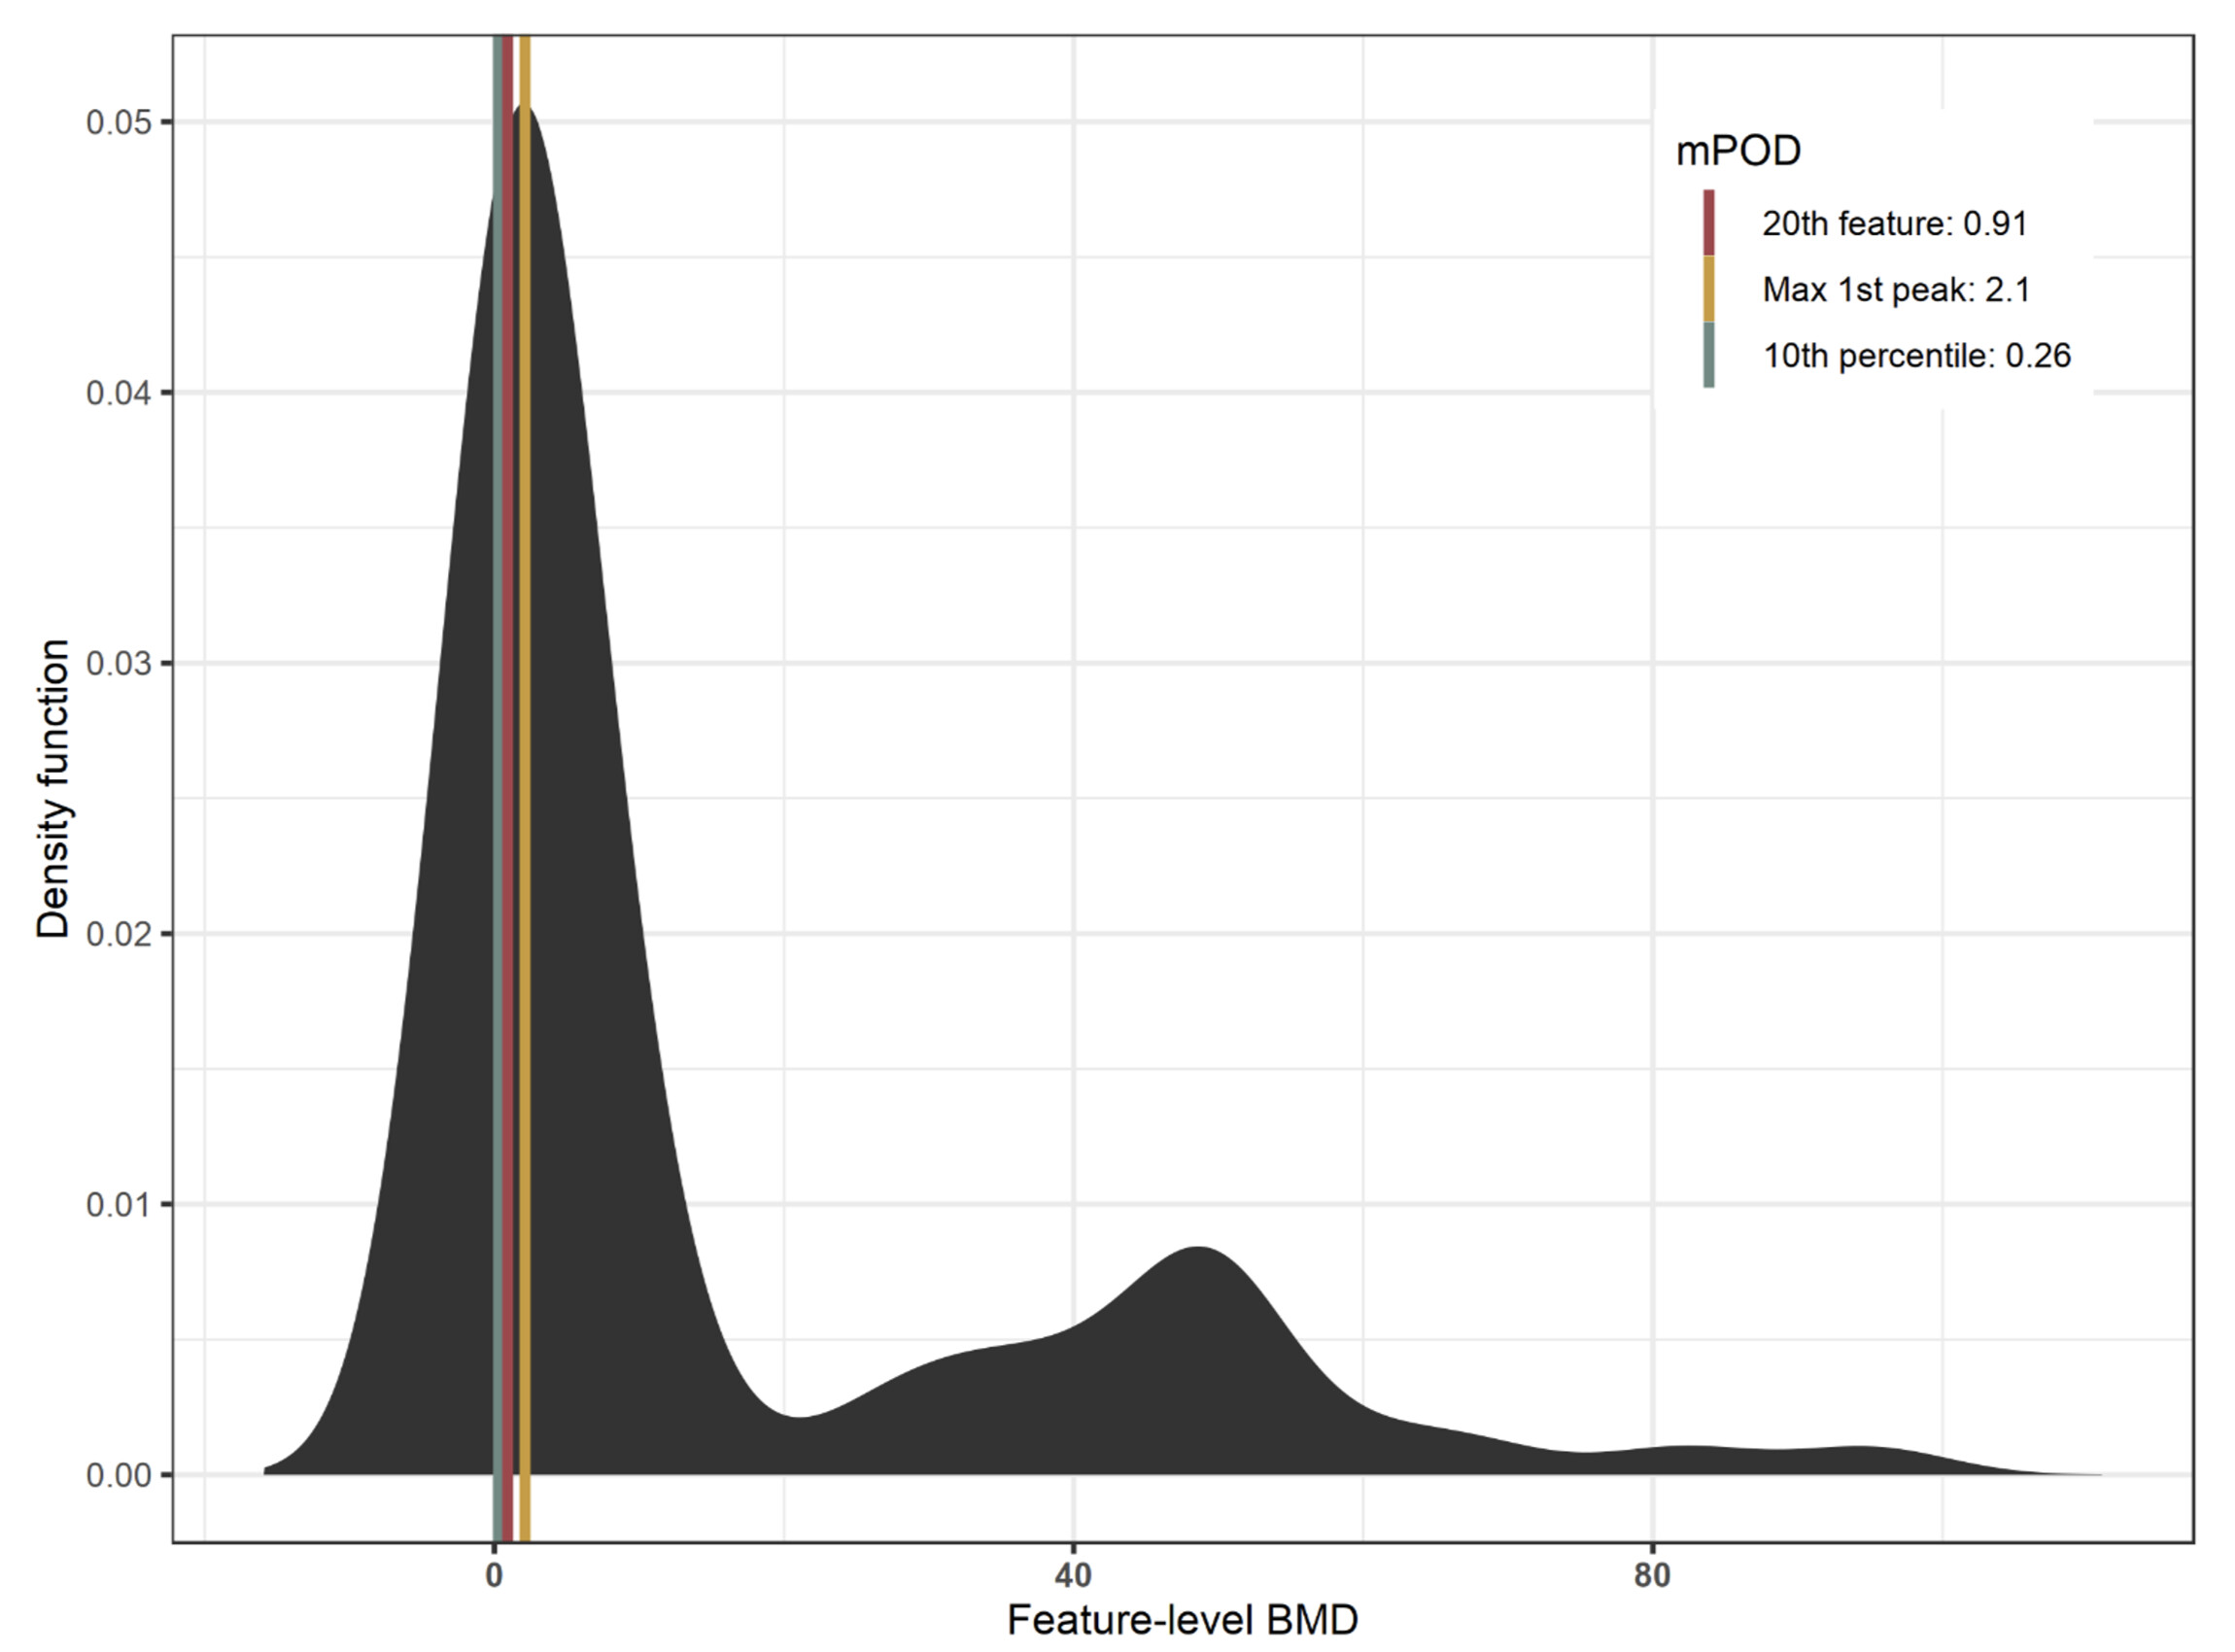
The mPoD or metabolomic-level point-of-departures is estimated based on the distribution of BMD values of the metabolic features. Three values are offered - the BMD value of 20th feature, the 10th percentile, or the most frequent BMD of the 1st curve. This follows the common practice in transcriptomics (tPOD). The result is presented graphically (see an example below)