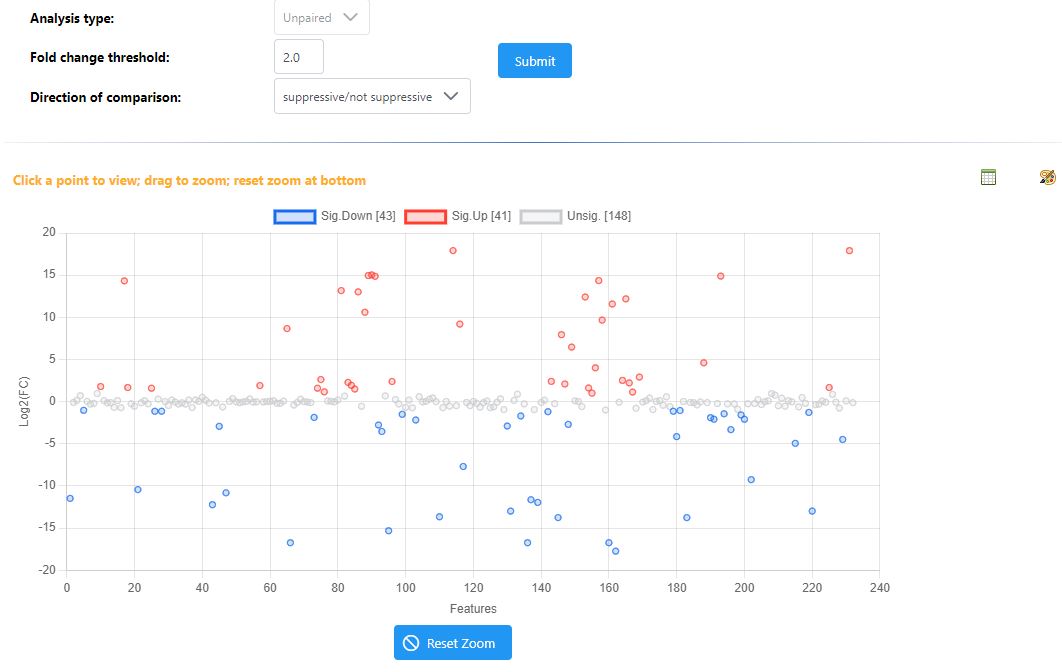
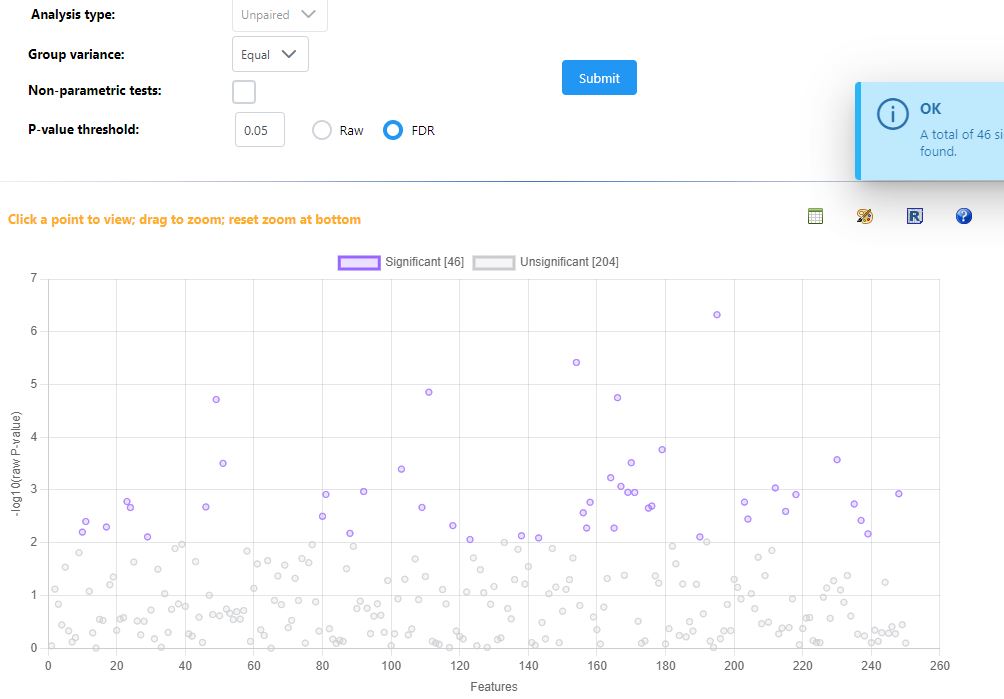
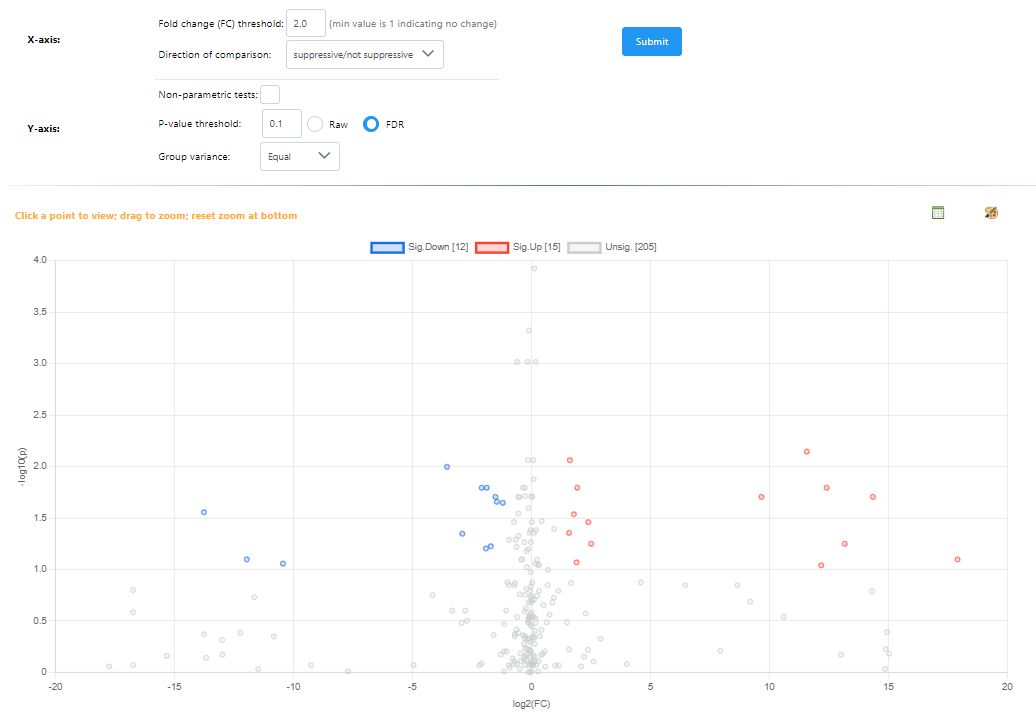
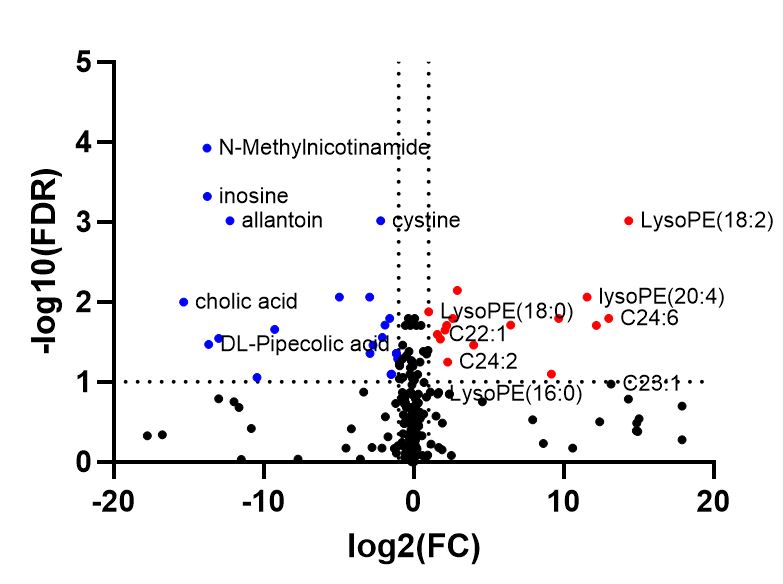
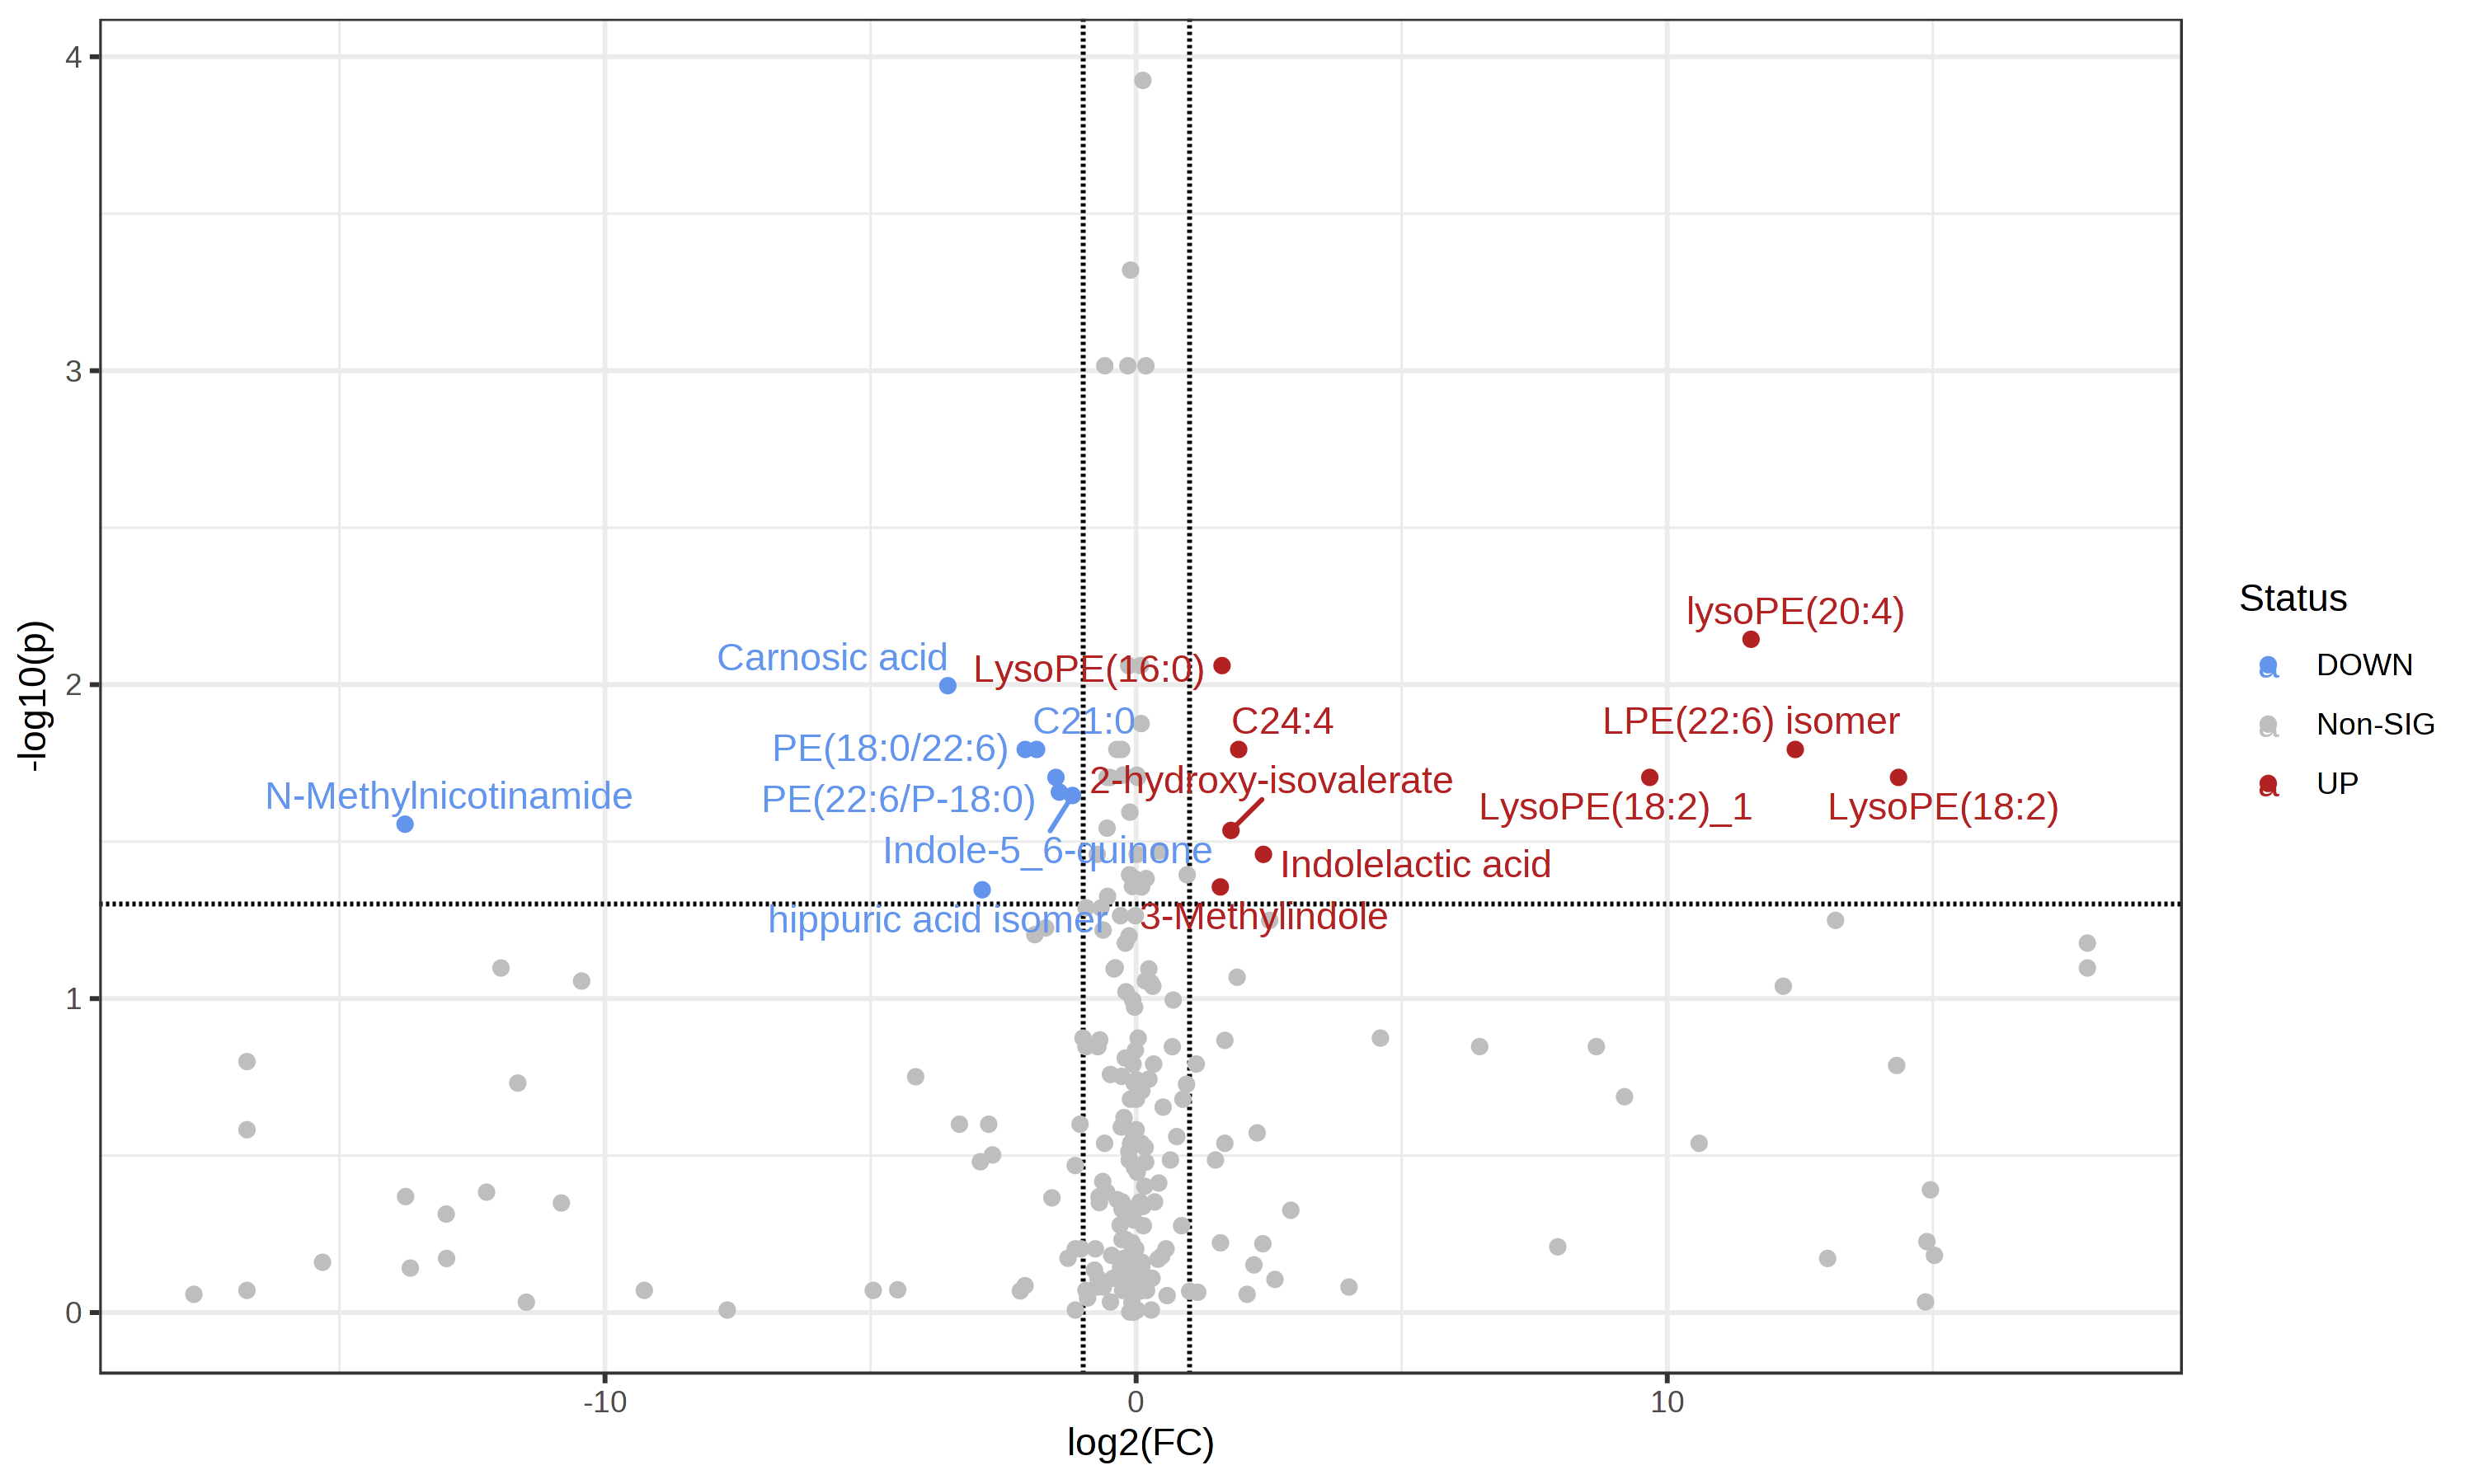
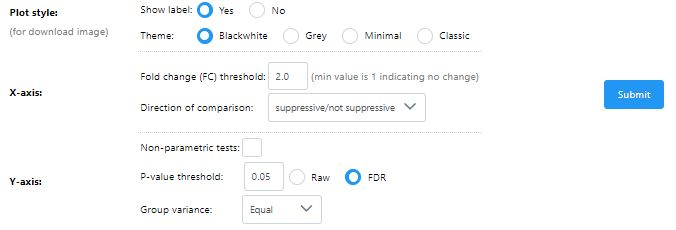
I noticed that the volcano plot I get from metaboanalyst doesn’t seem to be representative of what I see in the individual fold change / T test modules in metaboanalyst. When I output the individual values for the fold change and t-test from metaboanalyst and tried making my own volcano plot using the same parameters I was using in metaboanalyst I got a result that looked much more like what I expected. I’m unable to get the individual plotted values in the volcano plot from metaboanalyst since I get an error. I’m wondering if someone has run into this issue or could let me know what I’m doing wrong here?
I also got the csv output of values used in the volcano plot today and have attached that, and the cxv t_test and fold change outputs with the same settings I used in the screenshots above volcano (1).csv (977 Bytes) t_test (5).csv (2.3 KB) fold_change (3).csv (2.6 KB)
I can clearly see the issue in your results files - as you’ve described, the values in the volcano file fold change and p-value are different than the ones from the t-test and logFC files for specific compounds.
However, I can’t reproduce this problem with our example data. When I analyze in all three modules, download the results tables, and compare, the values are all consistent. Would it be possible for you to share your input files, along with your exact normalization steps so that I can reproduce and fix? You can disguise the files in some way, ie change group labels to meaningless A , B labels if you are concerned about sharing unpublised data.
Hi, I actually did more testing on the input file and I think that the issues were because I had done batch correction / normalization previously in R and was just centering in metaboanalyst. When I do the batch correction and normalization in metaboanalyst things look much better!