Hello, I use MetaboAnalyst in a course for my students to run PCA analysis of sample datasets. It hasn’t been working properly. Please see below:
-
Which tool and which module
- MetaboAnalyst → Principal Component Analysis (PCA)
-
Provide a copy of your data (the actual data file, not a screenshot image of the data), or indicate which example data you used
- Please see attached. 12.2 PCA Dataset.csv (5.2 KB)
-
Document all steps leading to the issue. Sometimes screenshots may be necessary
-
-
Here are the exact steps where I found it to be problematic:
-
MetaboAnalyst →
-
Statistical Analysis (one factor) →
-
A plain text file (.txt or .csv); Concentrations; Samples in rows (unpaired) –>
-
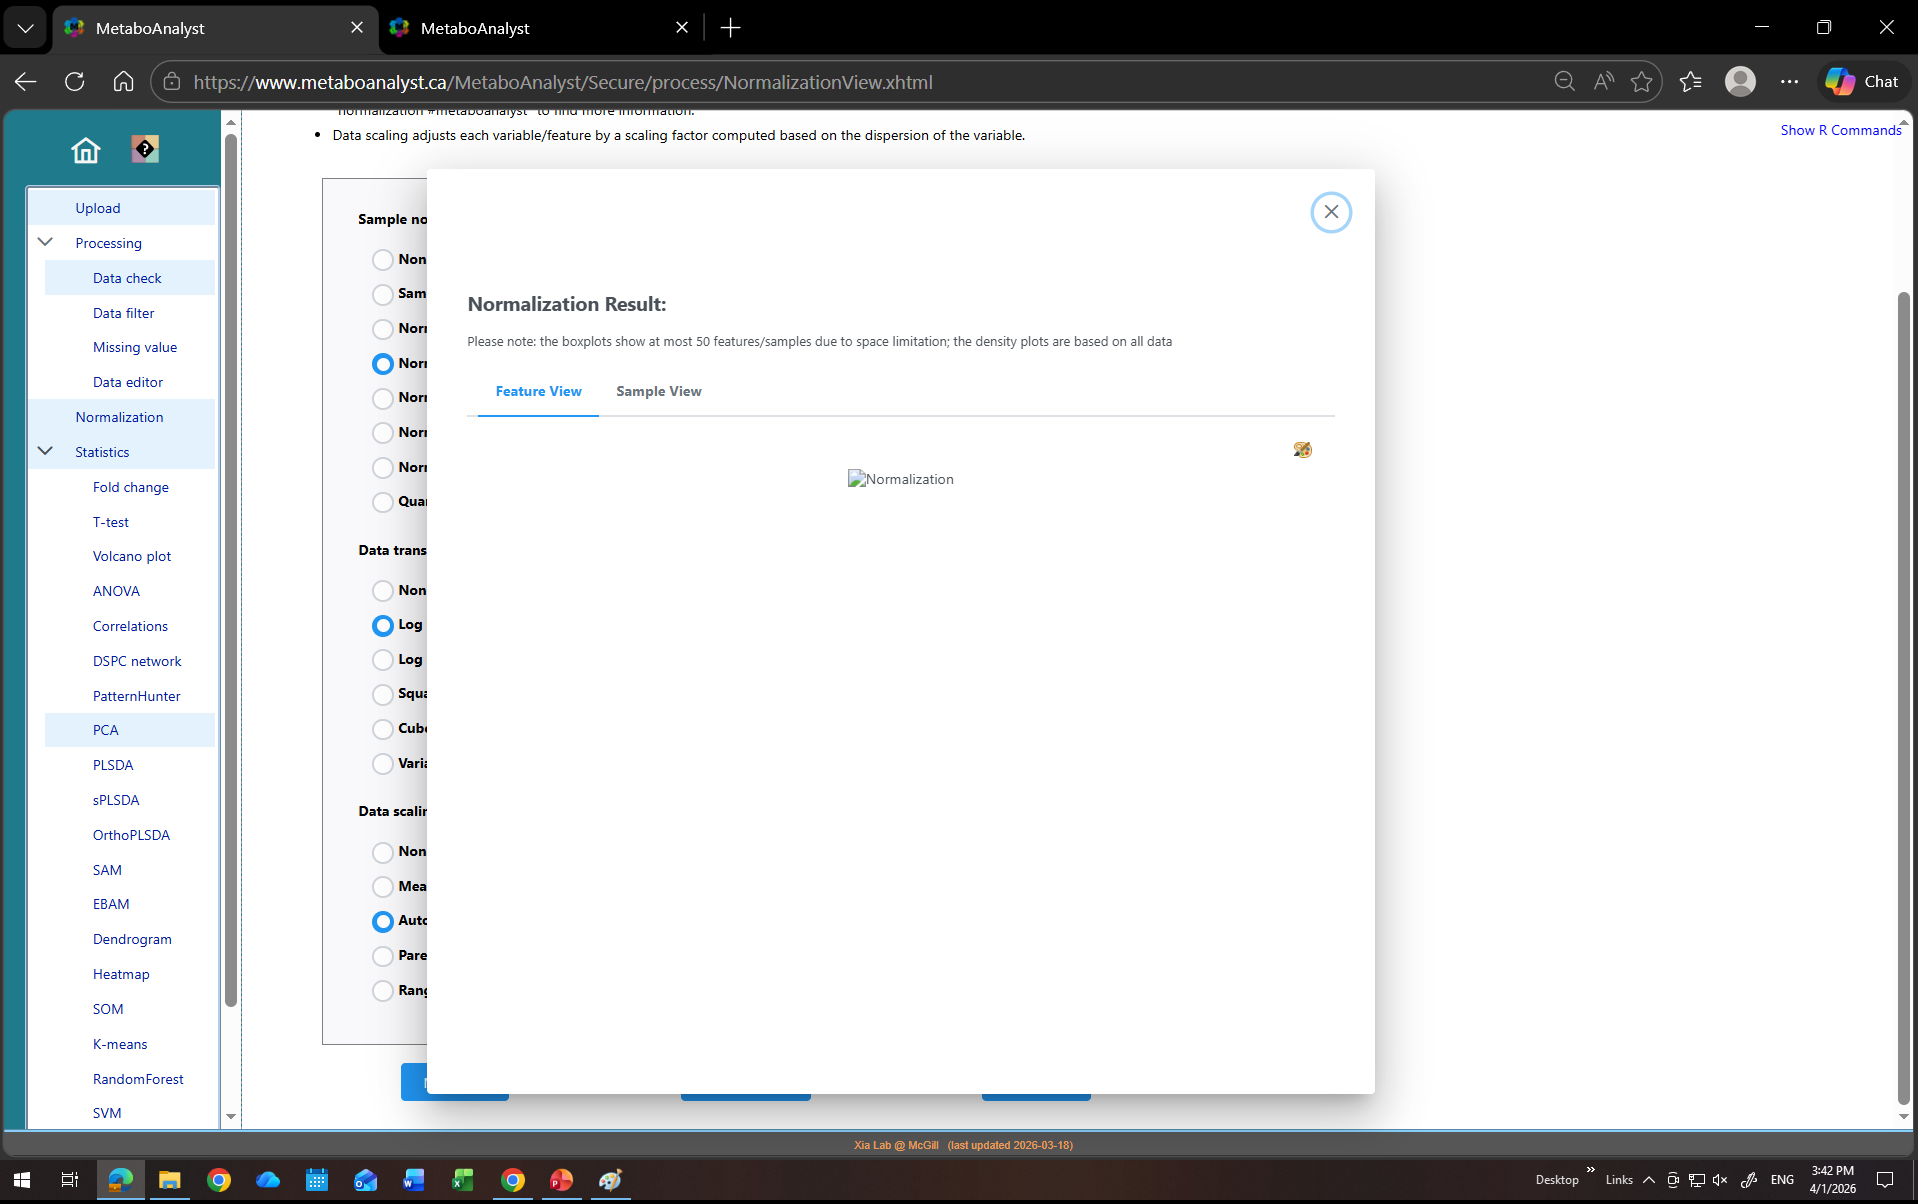
Sample normalization: Normalization by median; Log transformation (base 10); Auto Scaling; (NOTE: This is the 1st problem; I cannot visualize after ‘auto scaling’; But if I do NOT select ‘auto scaling, everything works fine)
→
-
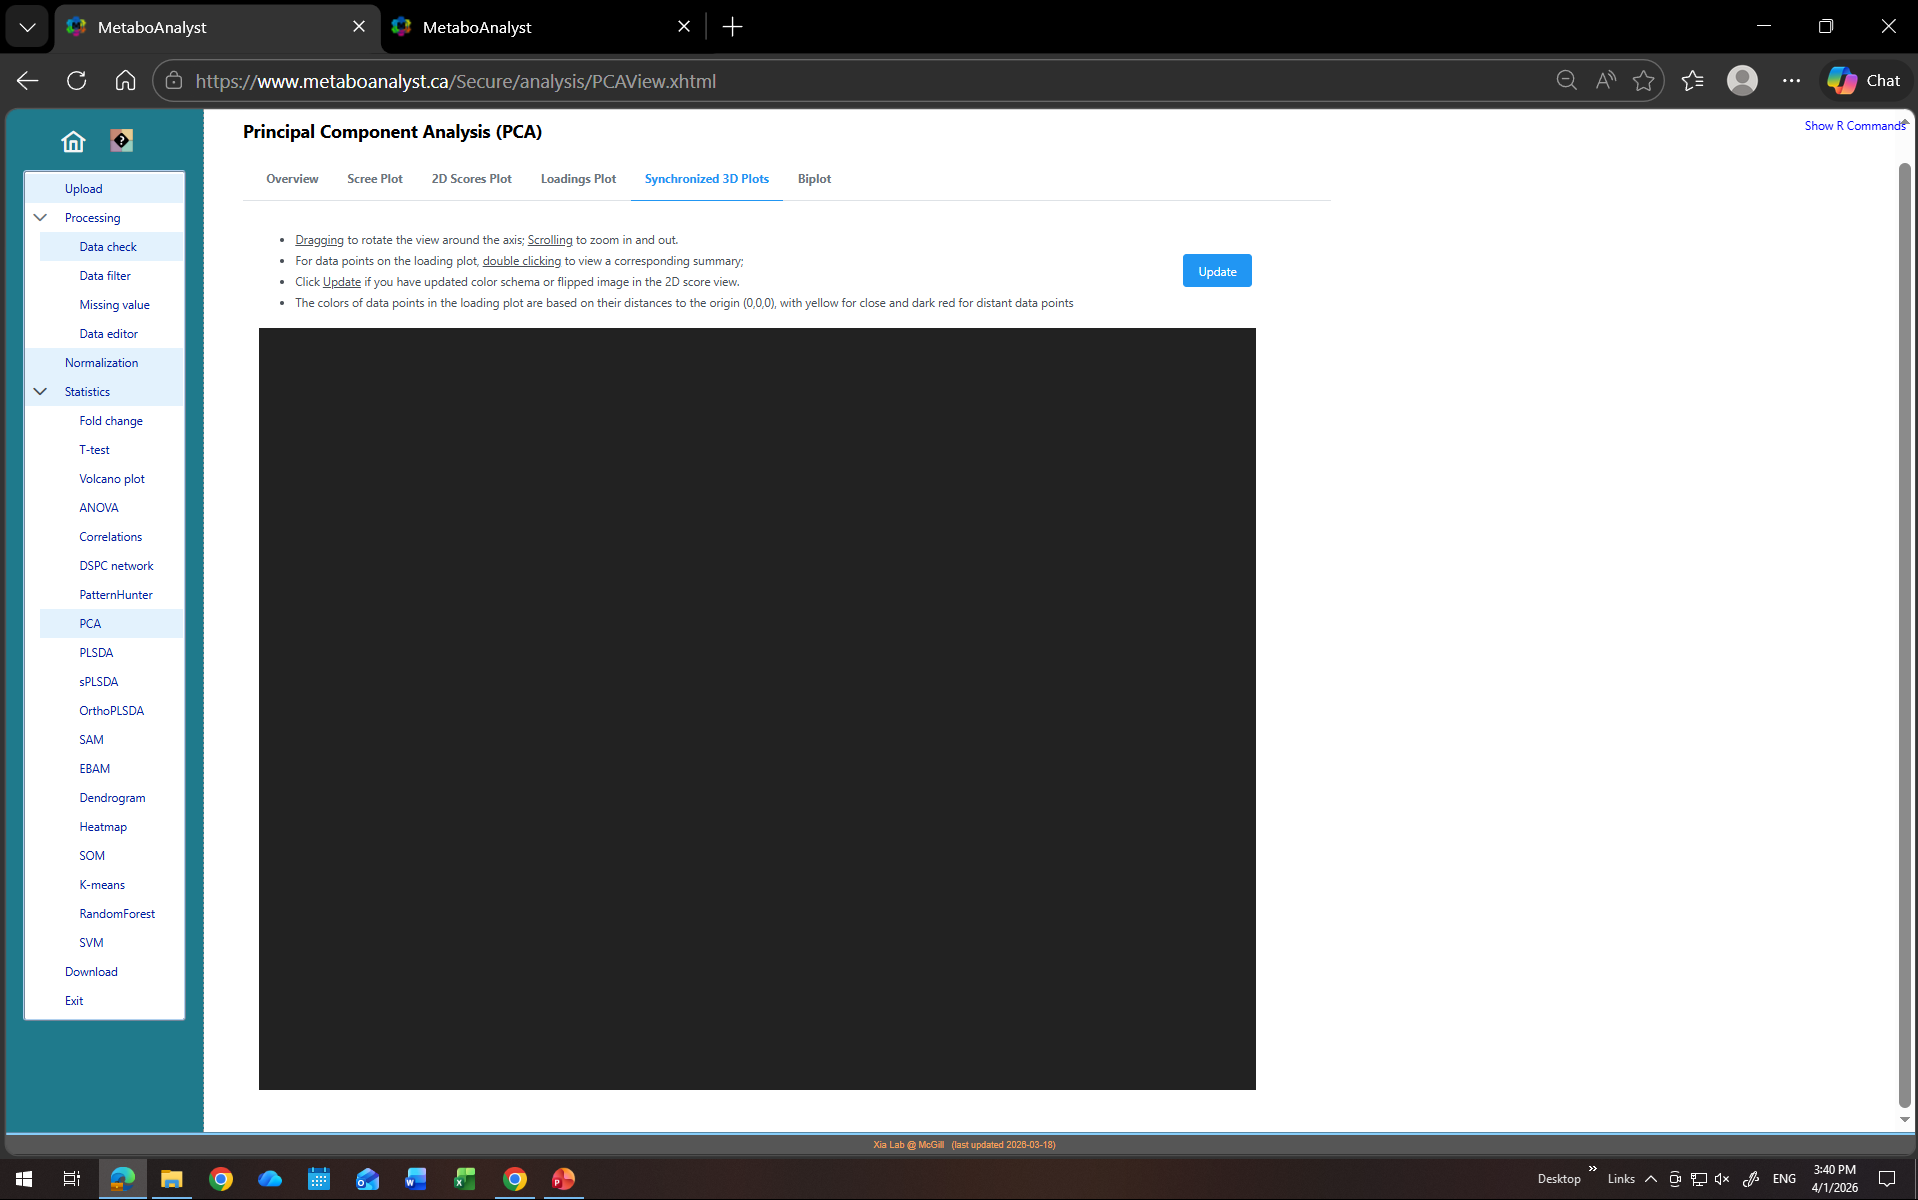
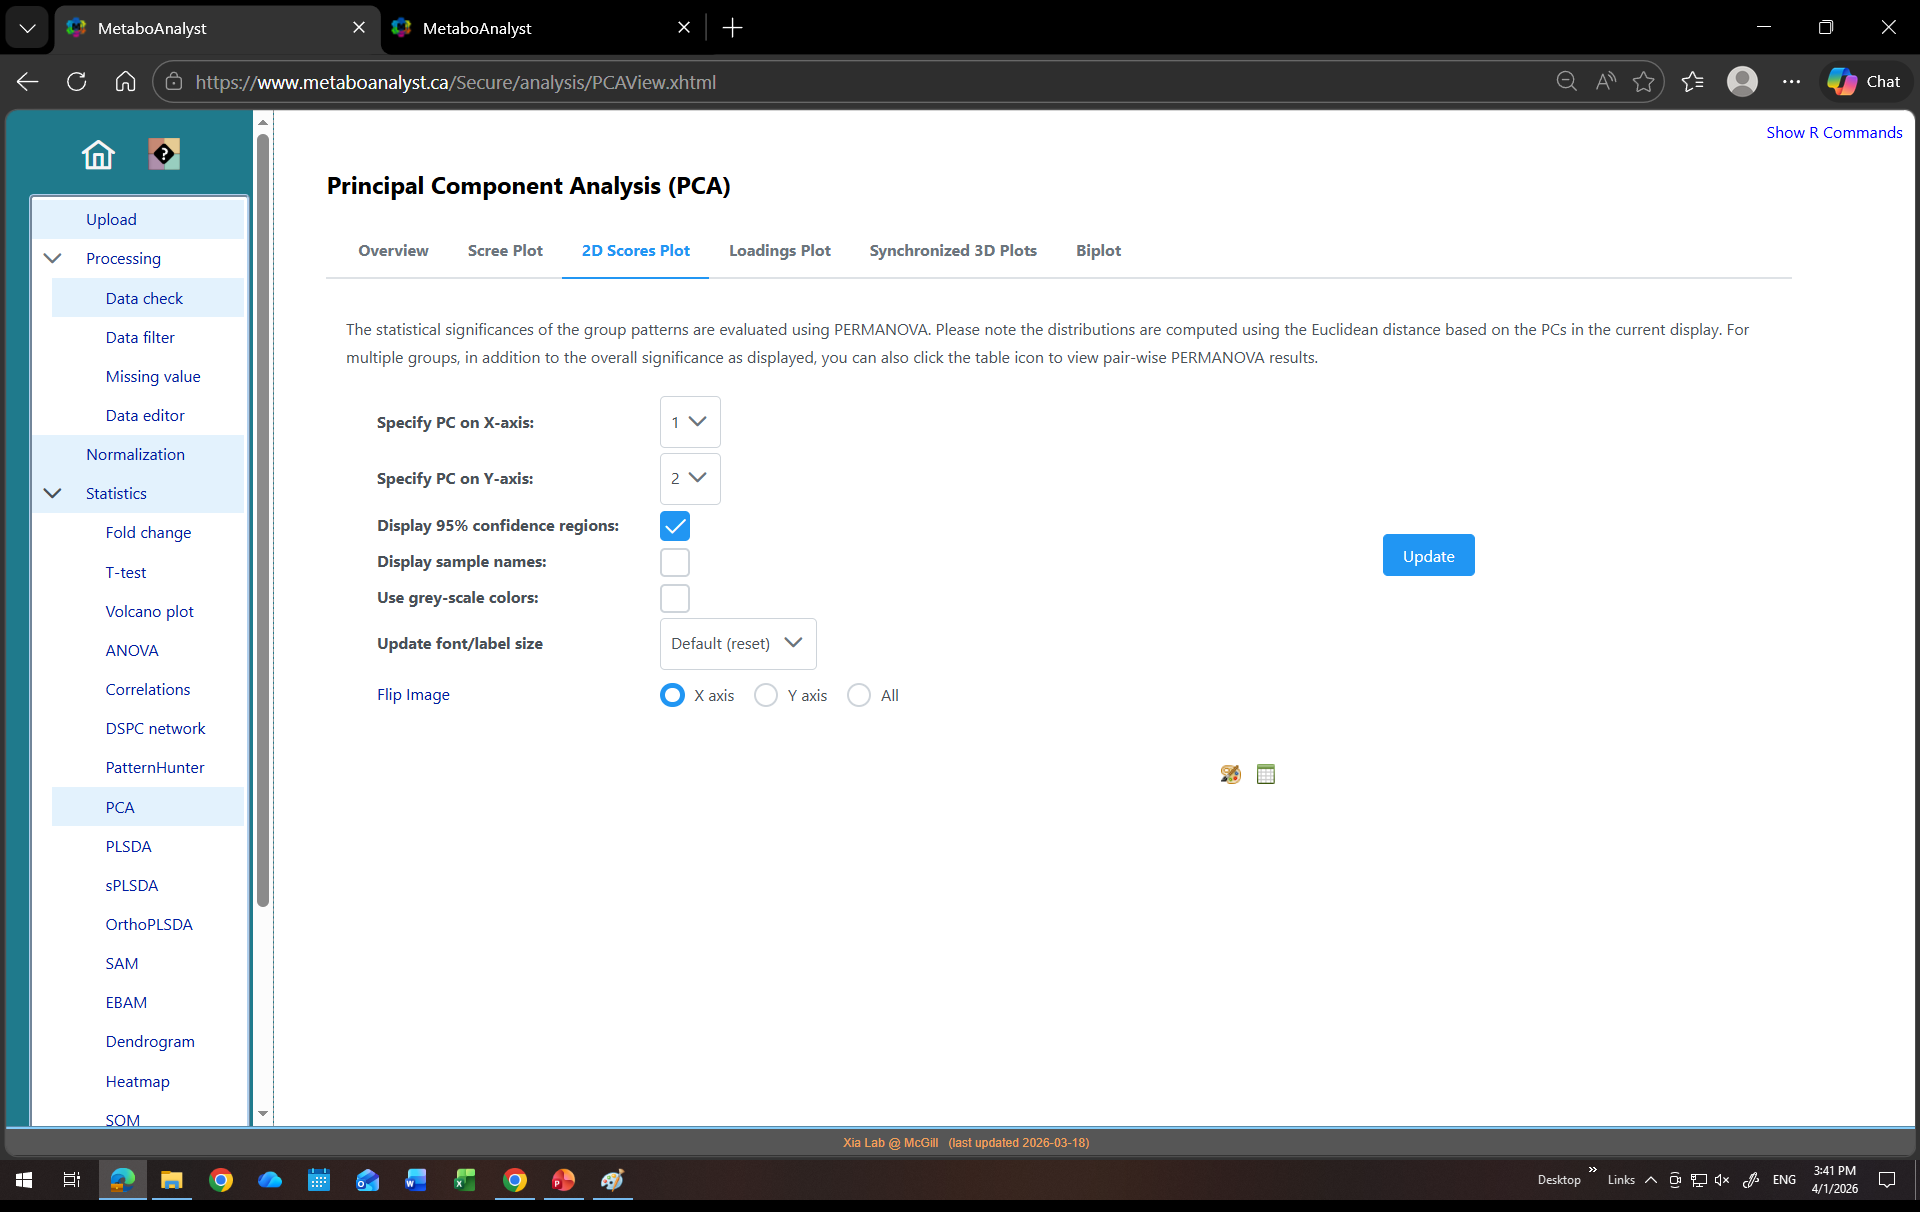
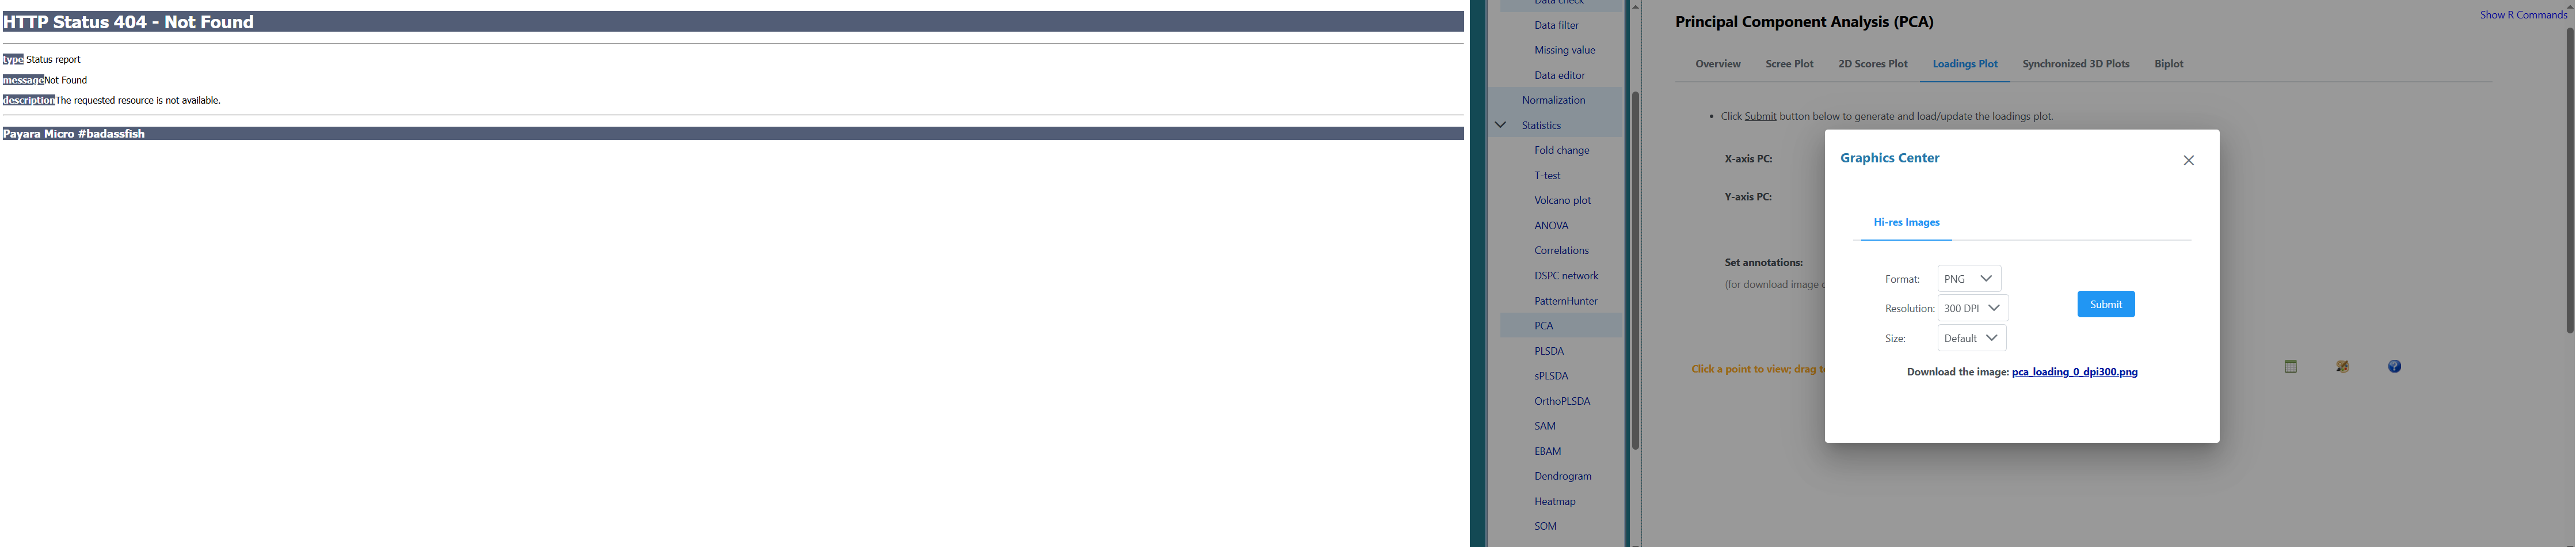
Principal Component Analysis (PCA) (this is where all other problems occur: no images or anything are loaded under ANY plots, please see screenshots attached; It also says “HTTP Status 404 - Not Found” when I try to download a plot. This is not a browser issue. I tried it on multiple browsers and computers. The issue seems to be with the ‘scaling’ function during data normalization.
* -
-