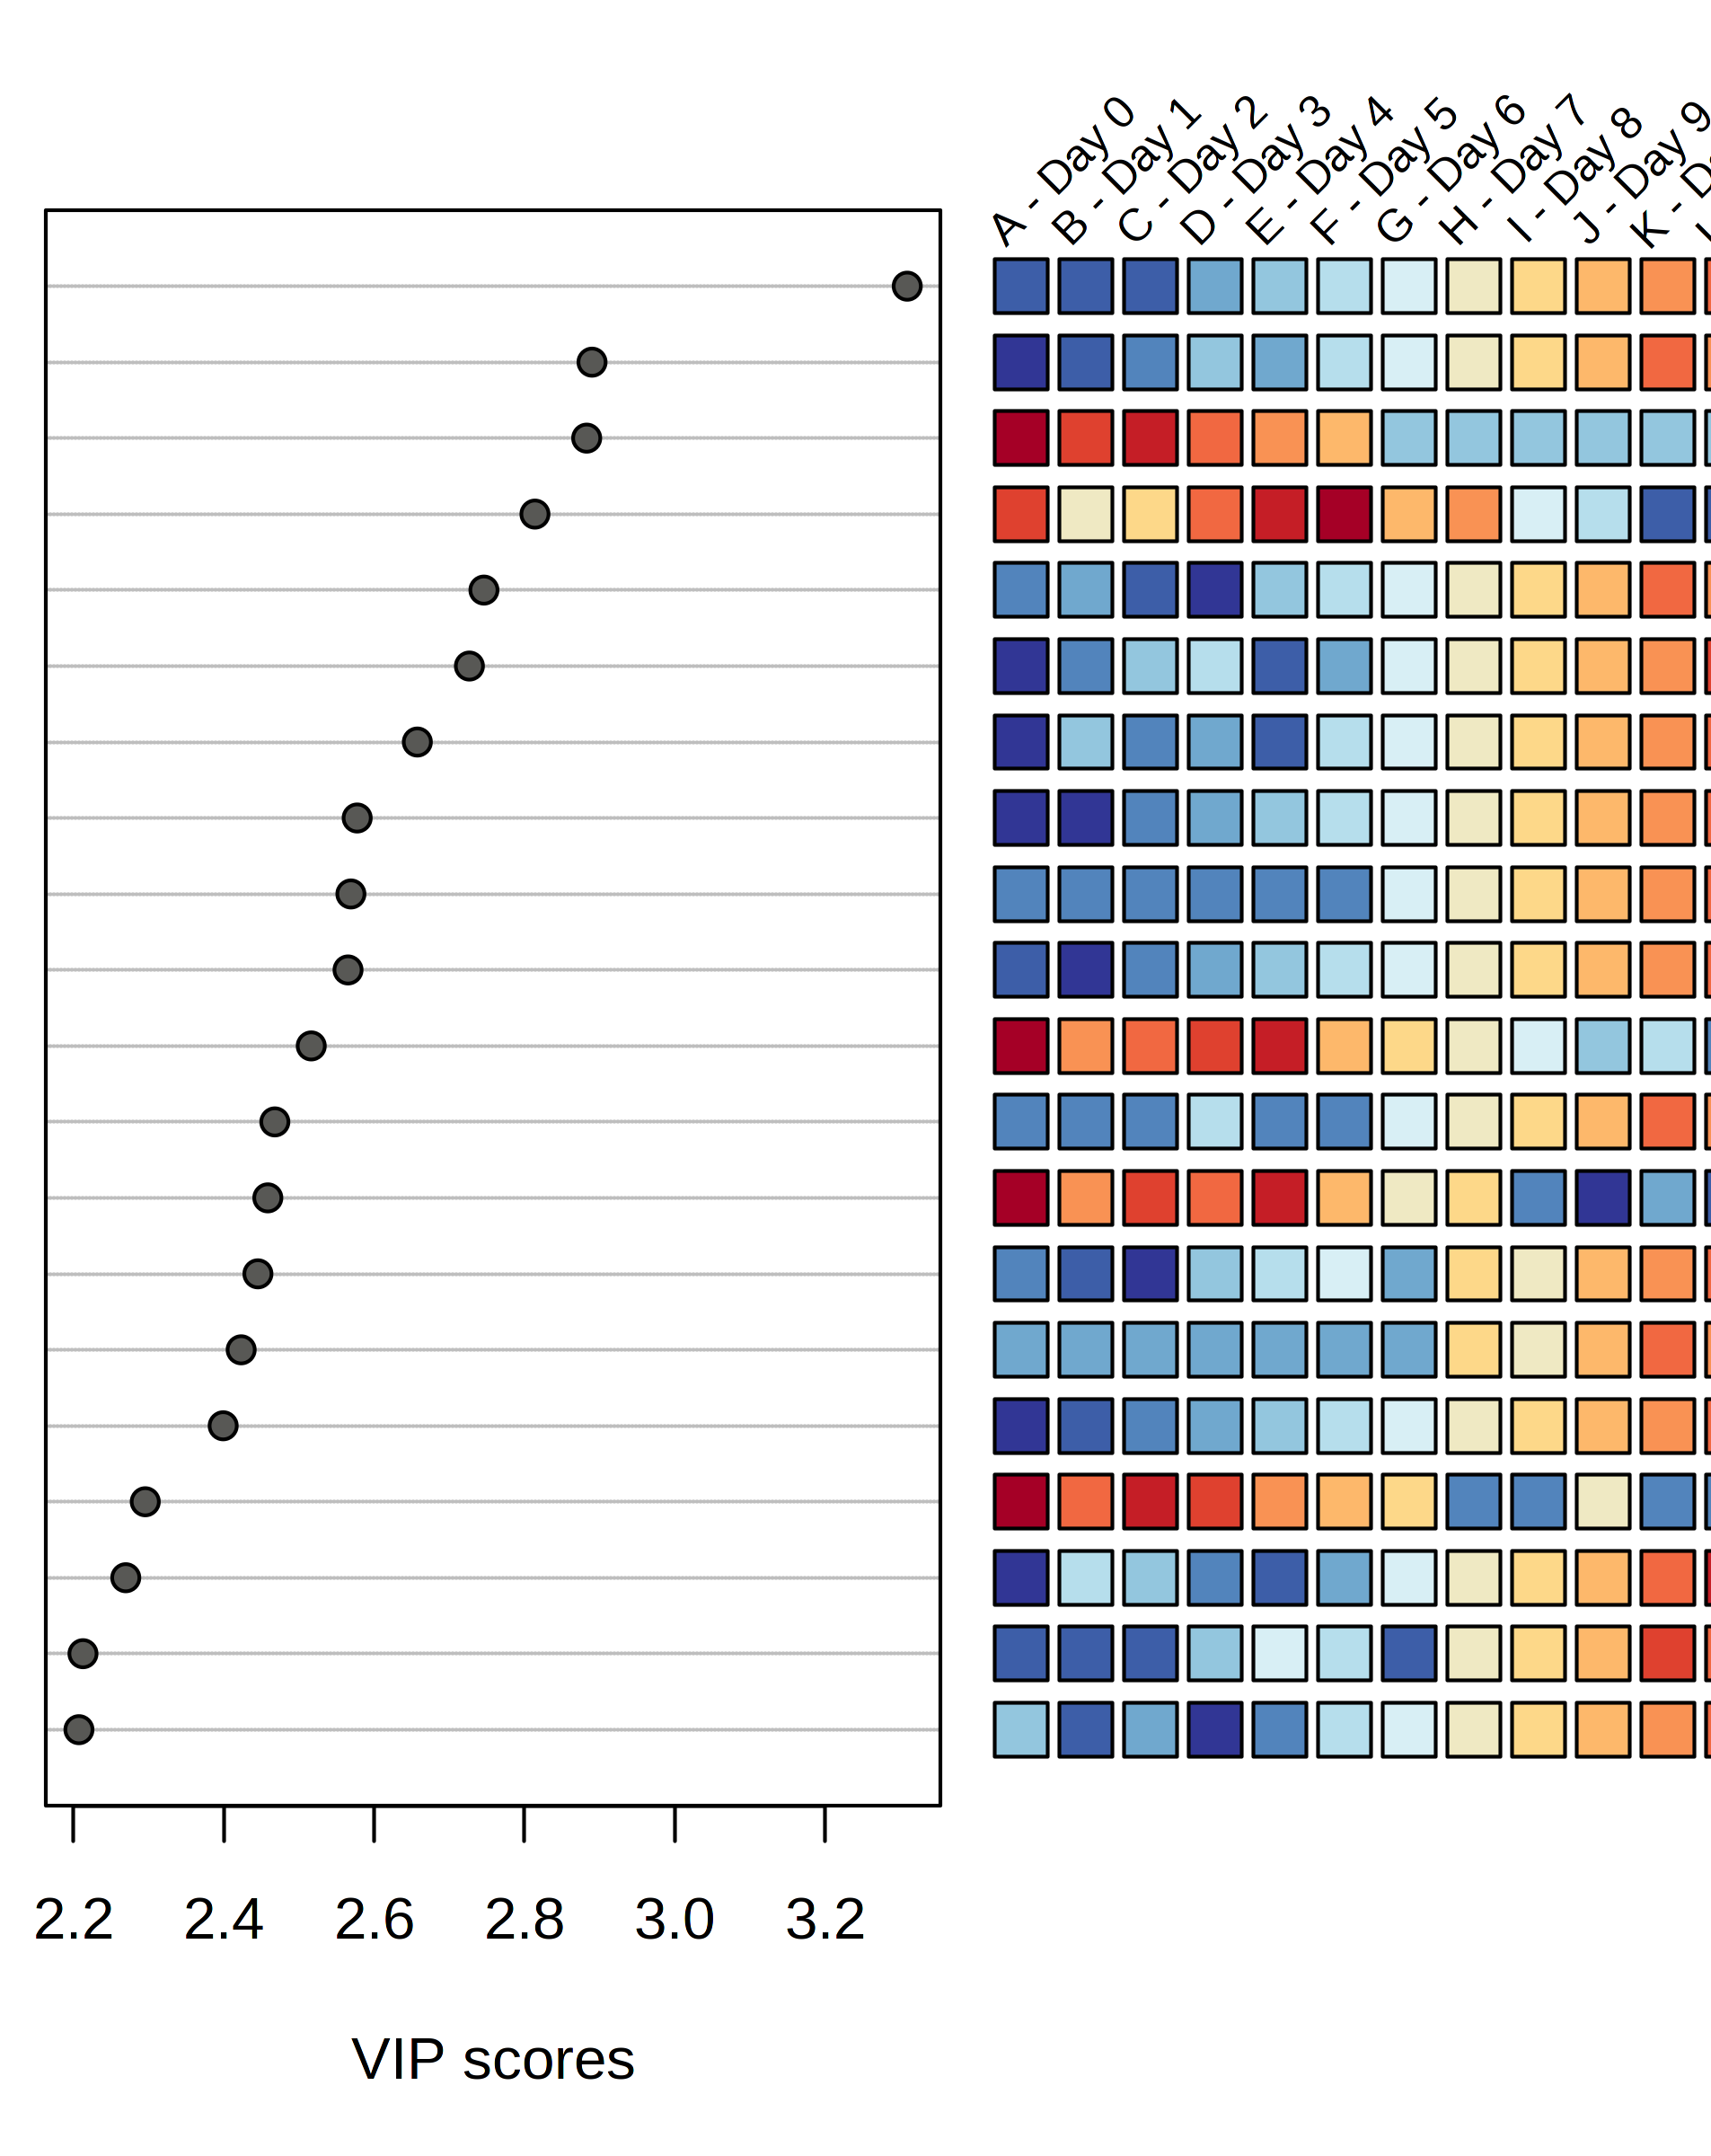
I have encountered a problem viewing the PLS-DA VIP plots for my 15 time-point series data. As you can see in the attached image, the heat boxes to the right of the VIP scores plot cut off at Day 9. There are 15 groups so I can’t see the last 6 groups in the heat boxes.
Is there any way to enlarge the field of view for figures in the web-based version of MetaboAnalyst 5.0 so I can visualise the heat boxes for all 15 groups? ( I have manually cropped out the metabolite names to the left of the VIP scores plot in this image before I uploaded it here).
Try downloading and viewing this plot separately and not from the report. If you are already downloading it as a .png file you could try opening it before downloading (300dpi) and then right click to ‘save image as’
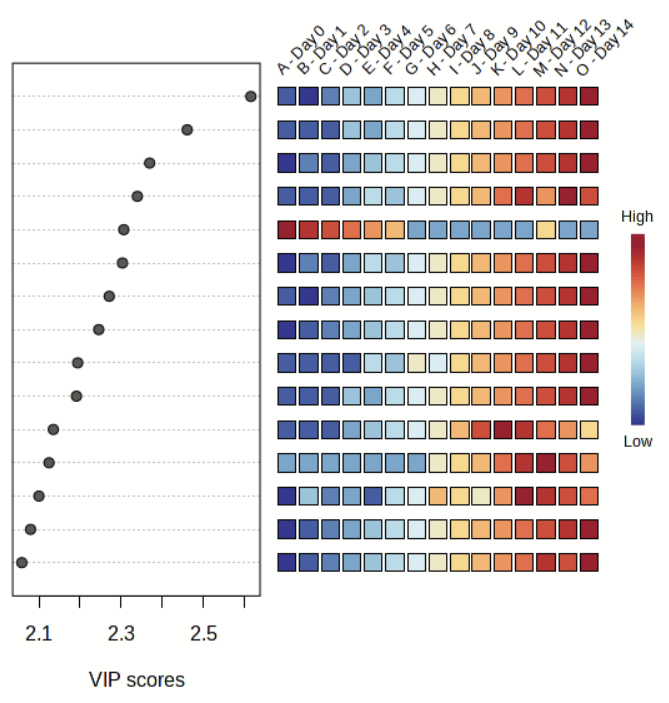
The entire time-series group is now displayed in the VIP plot figures (please see below). Thank you very much for making these changes, it’s much appreciated.