Hello,
I uploaded my lipidomics data (.csv) into Statistical Analysis (one factor). Then, using peak intensities, samples unpaired in columns, I am able to pass the data integrity check with 9.2% of values missing.
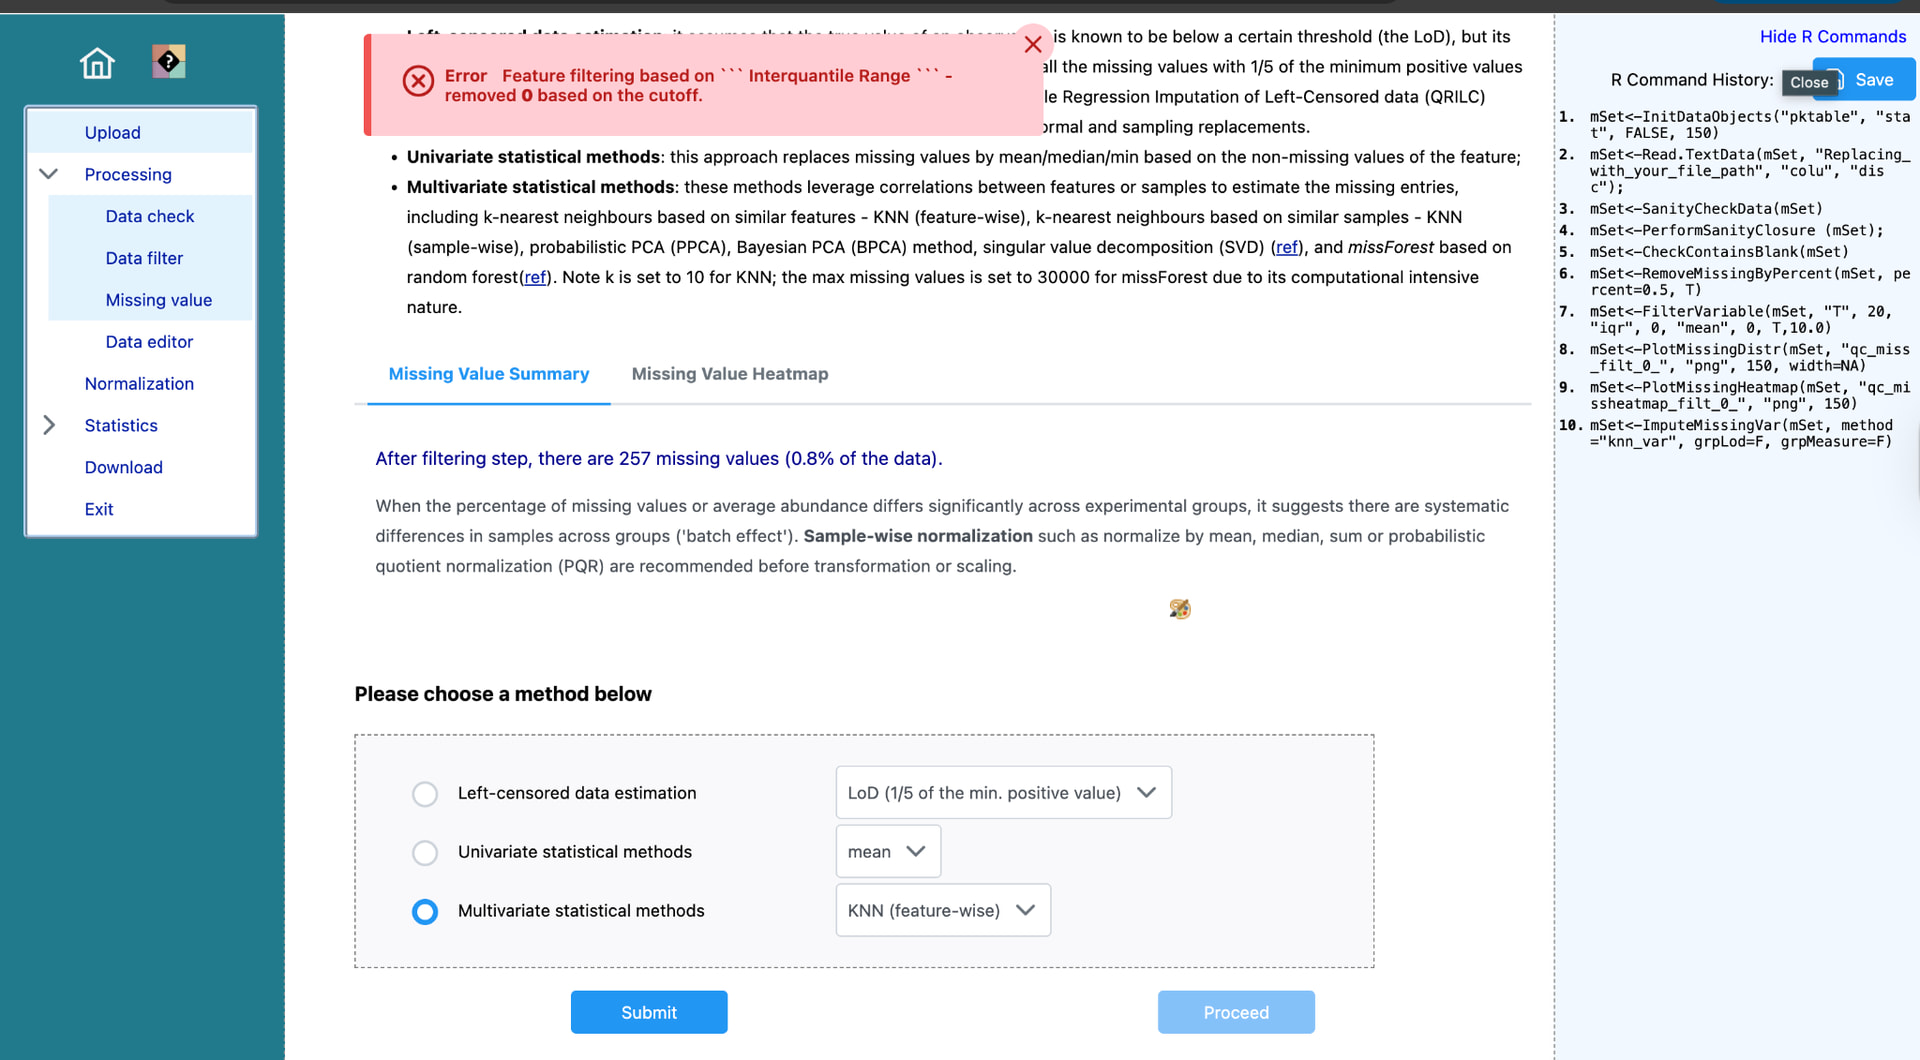
I then use the following settings: Enable blank subtraction (threshold 10), enable missing-value exclusion (remove features with > 50%, use group-wide threshold), filtering features based on QC samples (RSD > 20%), and low-variance and low-abundance filter set to 0. I am able to submit, and given the message “After filtering step, there are 257 missing values (0.8% of the data).”
When I go to impute the missing values (I am trying to use KNN, but other methods give the same result), I am getting the message “Error Feature filtering based on ``` Interquantile Range ``` - removed 0 based on the cutoff” and I am unable to hit proceed. I have included a screenshot below, but I am not sure how to troubleshoot. Thank you!
R Command History:
| 1. | mSet<-InitDataObjects(“pktable”, “stat”, FALSE, 150) |
|---|---|
| 2. | mSet<-Read.TextData(mSet, “Replacing_with_your_file_path”, “colu”, “disc”); |
| 3. | mSet<-SanityCheckData(mSet) |
| 4. | mSet<-PerformSanityClosure (mSet); |
| 5. | mSet<-CheckContainsBlank(mSet) |
| 6. | mSet<-RemoveMissingByPercent(mSet, percent=0.5, T) |
| 7. | mSet<-FilterVariable(mSet, “T”, 20, “iqr”, 0, “mean”, 0, T,10.0) |
| 8. | mSet<-PlotMissingDistr(mSet, “qc_miss_filt_0_”, “png”, 150, width=NA) |
| 9. | mSet<-PlotMissingHeatmap(mSet, “qc_missheatmap_filt_0_”, “png”, 150) |
| 10. | mSet<-ImputeMissingVar(mSet, method=“knn_var”, grpLod=F, grpMeasure=F) |