Dear Dr. Xia and Xia lab members,
Thank you very much for your support for your strong omics system. I have questions about MetaboAnalystR. I tried to use MetaboAnalystR using my own dataset, but noticed that some analyses I am able to perform using MetaboAnalyst 5.0 on the web cannot be analyzed using MetaboAnalystR. I used “TCE_feature_table.csv” and “TCE_metadata.csv” and encountered the same issues as below.
Does MetaboAnalystR miss several functions used in MetaboAnalyst (web)?
Your kind support is highly appreciated.
Sincerely,
#The following steps have been going well.
library(MetaboAnalystR)
mSet<-InitDataObjects(“pktable”, “mf”, FALSE)
mSet<-SetDesignType(mSet, “multi”)
mSet<-Read.TextDataTs(mSet, “TCE_feature_table.csv”, “colmf”);
mSet<-ReadMetaData(mSet, “TCE_metadata.csv”);
mSet<-SanityCheckData(mSet)
mSet<-ImputeMissingVar(mSet, method=“min”)
mSet<-SanityCheckMeta(mSet, 1)
mSet<-SetDataTypeOfMeta(mSet);
mSet<-SanityCheckData(mSet)
mSet<-FilterVariable(mSet, “none”, “F”, 25)
mSet<-PreparePrenormData(mSet)
mSet<-Normalization(mSet, “MedianNorm”, “LogNorm”, “AutoNorm”, ratio=FALSE, ratioNum=20)
mSet<-PlotNormSummary(mSet, “norm_0_”, “png”, 72, width=NA)
mSet<-PlotSampleNormSummary(mSet, “snorm_0_”, “png”, 72, width=NA)
mSet<-PlotMetaCorrHeatmap(mSet, “pearson”, “metaCorrHeatmap_0_”, “png”, 72, width=NA)
mSet<-PlotMetaHeatmap(mSet, “overview”, “both”, “euclidean”, “ward.D”, “bwm”, F, T, “metaHeatmap_0_”, “png”, 72, width=NA)
mSet ← PCA.Anal(mSet)
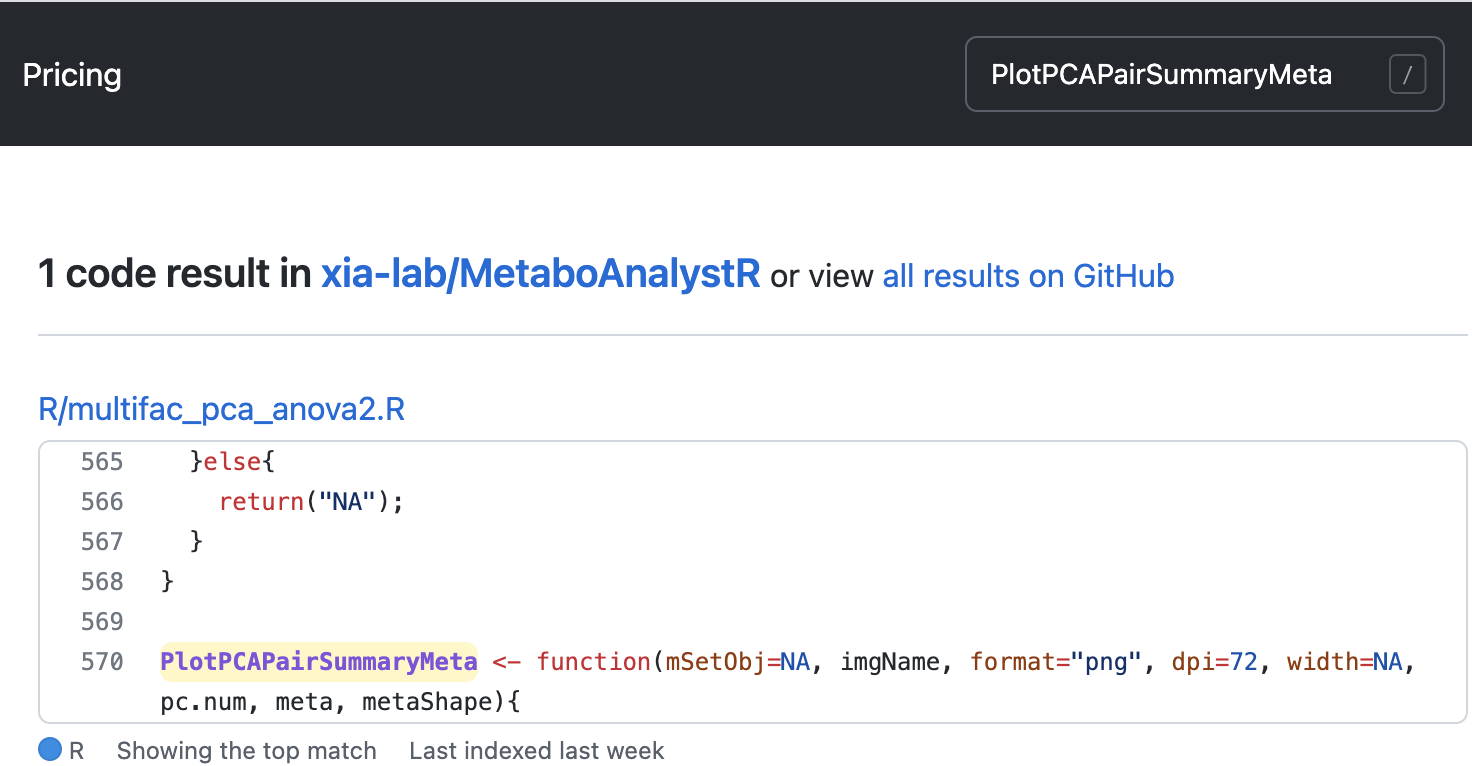
#The next code caused the following error stating that there is no function “PlotPCAPairSummaryMeta”
mSet<-PlotPCAPairSummaryMeta(mSet, “pca_pair_meta_TCE_Exp_Sex_”, “png”, 72, width=NA, 5, “TCE_Exp_Category”, “Sex”)
Error in PlotPCAPairSummaryMeta(mSet, “pca_pair_bup_coke_0_”, “png”, 300, :
could not find function “PlotPCAPairSummaryMeta”
#Here is another error stating that there is no function “FeatureCorrelationMeta”
mSet<-FeatureCorrelationMeta(mSet, “pearson”, “metaNm”, “TCE_Exp_Binary”)
Error in FeatureCorrelationMeta(mSet, “pearson”, “metaNm”, “TCE_Exp_Binary”) :
could not find function “FeatureCorrelationMeta”
##For Linear models with covariate adjustment, I tried to define covariates (Control for) but cannot define the vector.
adj.vec <<- [Age, Sex, Batch] ####Can the covariates be defined in MetaboAnalystR?
Error: unexpected ‘[’ in “adj.vec <<- [”
##Similarly, I encountered a similar issue when I tried to select two metadata for ANOVA2
meta.vec.aov ← [TCE_Exp_Category, Sex]
Error: unexpected ‘[’ in “meta.vec.aov ← [”
#Finally here is the sessioninfo().
sessionInfo()
R version 4.2.2 (2022-10-31 ucrt)
Platform: x86_64-w64-mingw32/x64 (64-bit)
Running under: Windows 10 x64 (build 22000)
Matrix products: default
locale:
[1] LC_COLLATE=English_United States.utf8
[2] LC_CTYPE=English_United States.utf8
[3] LC_MONETARY=English_United States.utf8
[4] LC_NUMERIC=C
[5] LC_TIME=English_United States.utf8
attached base packages:
[1] stats graphics grDevices utils datasets methods base
other attached packages:
[1] MetaboAnalystR_3.3.0
loaded via a namespace (and not attached):
[1] nlme_3.1-160 bitops_1.0-7 lubridate_1.9.2
[4] bit64_4.0.5 httr_1.4.4 RColorBrewer_1.1-3
[7] tools_4.2.2 utf8_1.2.3 R6_2.5.1
[10] rpart_4.1.19 KernSmooth_2.23-20 lazyeval_0.2.2
[13] DBI_1.1.3 BiocGenerics_0.42.0 colorspace_2.1-0
[16] nnet_7.3-18 withr_2.5.0 tidyselect_1.2.0
[19] gridExtra_2.3 bit_4.0.5 compiler_4.2.2
[22] cli_3.6.0 Biobase_2.56.0 Cairo_1.6-0
[25] plotly_4.10.1 stringfish_0.15.7 caTools_1.18.2
[28] scales_1.2.1 stringr_1.5.0 digest_0.6.31
[31] rmarkdown_2.20 siggenes_1.70.0 pkgconfig_2.0.3
[34] htmltools_0.5.4 parallelly_1.34.0 scrime_1.3.5
[37] fastmap_1.1.0 limma_3.52.4 htmlwidgets_1.6.1
[40] rlang_1.0.6 rstudioapi_0.14 RSQLite_2.3.0
[43] impute_1.70.0 generics_0.1.3 RApiSerialize_0.1.2
[46] jsonlite_1.8.4 crmn_0.0.21 BiocParallel_1.30.4
[49] gtools_3.9.4 ModelMetrics_1.2.2.2 dplyr_1.1.0
[52] magrittr_2.0.3 Matrix_1.5-3 Rcpp_1.0.10
[55] munsell_0.5.0 fansi_1.0.4 lifecycle_1.0.3
[58] pROC_1.18.0 stringi_1.7.12 yaml_2.3.7
[61] edgeR_3.38.4 MASS_7.3-58.1 gplots_3.1.3
[64] plyr_1.8.8 recipes_1.0.5 grid_4.2.2
[67] blob_1.2.3 parallel_4.2.2 listenv_0.9.0
[70] lattice_0.20-45 splines_4.2.2 multtest_2.52.0
[73] locfit_1.5-9.7 knitr_1.42 pillar_1.8.1
[76] fgsea_1.22.0 igraph_1.4.0 reshape2_1.4.4
[79] future.apply_1.10.0 codetools_0.2-18 stats4_4.2.2
[82] fastmatch_1.1-3 glue_1.6.2 evaluate_0.20
[85] pcaMethods_1.88.0 data.table_1.14.8 RcppParallel_5.1.6
[88] vctrs_0.5.2 foreach_1.5.2 tidyr_1.3.0
[91] purrr_1.0.1 gtable_0.3.1 qs_0.25.5
[94] future_1.31.0 cachem_1.0.6 ggplot2_3.4.1
[97] xfun_0.37 gower_1.0.1 prodlim_2019.11.13
[100] viridisLite_0.4.1 class_7.3-20 survival_3.4-0
[103] glasso_1.11 timeDate_4022.108 tibble_3.1.8
[106] iterators_1.0.14 memoise_2.0.1 hardhat_1.2.0
[109] lava_1.7.1 timechange_0.2.0 globals_0.16.2
[112] caret_6.0-93 ipred_0.9-13