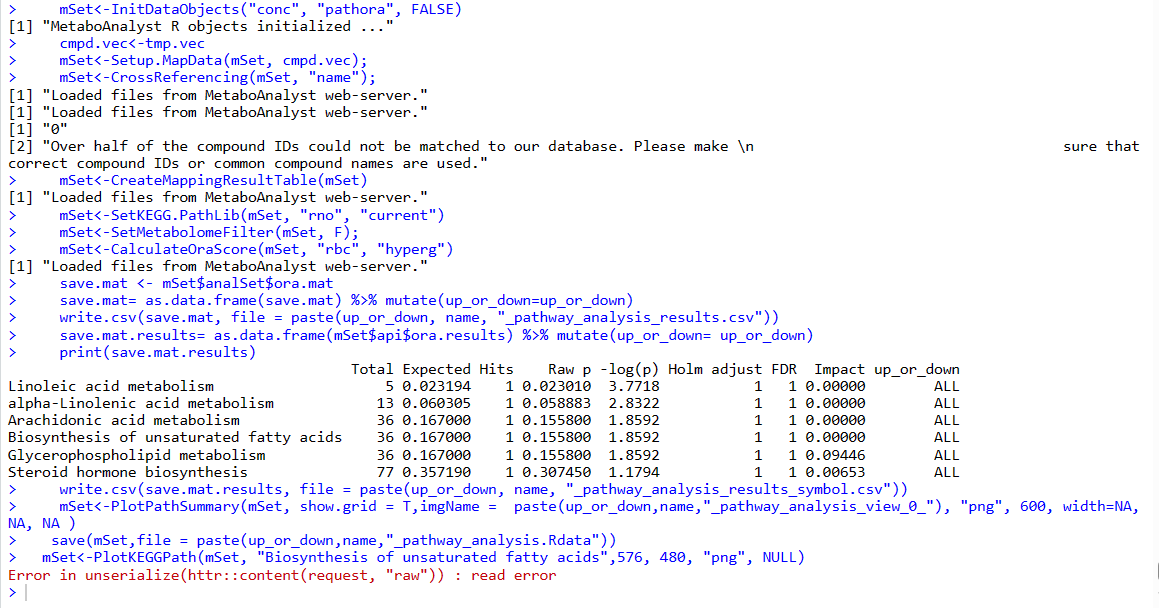
The “Raw p” of the pathwasy_results analyzed by R is quite different from that of MetaboAnalyst online.
Which one is right?
- R analysis:
library(MetaboAnalystR)
mSet<-InitDataObjects(“conc”, “pathora”, FALSE)
cmpd.vec<-c(“HMDB0007089”,“HMDB0060086”,“HMDB0002220”,“HMDB0005042”,“HMDB0009917”,“HMDB0060781”,“HMDB0032884”,“HMDB0034033”,“HMDB0029982”,“HMDB0060713”,“HMDB0007848”,“HMDB0030914”,“HMDB0002429”,“HMDB0009725”,“HMDB0035518”,“HMDB0112407”,“HMDB0043249”,“HMDB0002204”,“HMDB0114976”,“HMDB0038337”,“HMDB0013488”,“HMDB0033614”,“HMDB0038357”,“HMDB0000153”,“HMDB0006606”,“HMDB0002472”,“HMDB0039536”,“HMDB0004978”,“HMDB0033917”,“HMDB0006404”,“HMDB0116640”,“HMDB0032949”,“HMDB0060058”,“HMDB0040851”,“HMDB0012093”,“HMDB0037748”,“HMDB0005359”,“HMDB0000652”,“HMDB0130524”,“HMDB0038713”,“HMDB0013646”,“HMDB0043433”,“HMDB0125353”,“HMDB0040484”,“HMDB0008749”,“HMDB0034651”,“HMDB0028722”,“HMDB0034636”,“HMDB0011760”,“HMDB0030755”,“HMDB0038298”,“HMDB0035388”,“HMDB0125084”,“HMDB0031886”,“HMDB0112425”,“HMDB0040537”,“HMDB0035956”,“HMDB0009184”,“HMDB0011118”,“HMDB0094373”,“HMDB0011146”,“HMDB0128150”,“HMDB0011612”,“HMDB0014342”,“HMDB0061668”,“HMDB0062731”,“HMDB0042100”,“HMDB0056061”,“HMDB0038866”,“HMDB0035174”,“HMDB0014945”,“HMDB0036010”,“HMDB0042083”,“HMDB0011684”,“HMDB0036928”,“HMDB0031980”,“HMDB0039646”,“HMDB0116644”,“HMDB0029205”,“HMDB0116660”,“HMDB0012212”,“HMDB0030641”,“HMDB0037911”,“HMDB0034703”,“HMDB0143633”,“HMDB0133131”,“HMDB0008856”,“HMDB0056377”,“HMDB0135847”,“HMDB0036121”,“HMDB0034711”,“HMDB0012342”,“HMDB0007019”,“HMDB0038229”,“HMDB0029853”,“HMDB0008832”,“HMDB0037984”,“HMDB0125967”,“HMDB0030415”,“HMDB0013531”,“HMDB0014536”,“HMDB0040816”,“HMDB0031394”,“HMDB0129209”,“HMDB0004668”,“HMDB0012105”,“HMDB0035150”,“HMDB0036295”,“HMDB0001833”,“HMDB0048293”,“HMDB0007012”,“HMDB0034249”,“HMDB0112171”,“HMDB0030130”,“HMDB0039306”,“HMDB0039054”,“HMDB0006737”,“HMDB0240235”,“HMDB0036863”,“HMDB0060995”,“HMDB0071246”,“HMDB0127108”,“HMDB0040318”,“HMDB0030778”,“HMDB0115038”,“HMDB0036321”,“HMDB0029877”,“HMDB0060164”,“HMDB0094682”,“HMDB0003327”,“HMDB0031275”,“HMDB0029499”,“HMDB0039624”,“HMDB0127226”,“HMDB0060156”,“HMDB0012643”,“HMDB0031837”,“HMDB0030401”,“HMDB0134225”,“HMDB0010585”,“HMDB0062344”,“HMDB0030098”,“HMDB0034430”,“HMDB0115502”,“HMDB0029531”,“HMDB0127351”,“HMDB0034473”,“HMDB0029323”,“HMDB0032642”,“HMDB0014531”,“HMDB0126397”,“HMDB0014681”,“HMDB0033886”,“HMDB0014827”,“HMDB0041080”,“HMDB0039636”,“HMDB0133406”,“HMDB0240260”,“HMDB0015616”,“HMDB0028723”,“HMDB0032831”,“HMDB0029344”,“HMDB0128904”,“HMDB0006347”,“HMDB0014425”,“HMDB0038928”,“HMDB0112357”,“HMDB0040523”,“HMDB0007029”,“HMDB0240278”,“HMDB0034637”,“HMDB0126263”,“HMDB0061137”,“HMDB0003063”,“HMDB0032840”,“HMDB0033635”,“HMDB0128193”,“HMDB0126672”,“HMDB0034600”,“HMDB0037833”,“HMDB0008042”,“HMDB0040282”,“HMDB0126390”,“HMDB0014669”)
mSet<-Setup.MapData(mSet, cmpd.vec);
mSet<-CrossReferencing(mSet, “hmdb”);
mSet<-CreateMappingResultTable(mSet)
mSet<-SetKEGG.PathLib(mSet, “hsa”, “current”)
mSet<-SetMetabolomeFilter(mSet, F);
mSet<-CalculateOraScore(mSet, “rbc”, “hyperg”)
mSet<-PlotPathSummary(mSet, F, “path_view_0_”, “png”, 72, width=NA, NA, NA )
mSet<-PlotKEGGPath(mSet, “Glycerophospholipid metabolism”,576, 480, “png”, NULL)
mSet<-RerenderMetPAGraph(mSet, “zoom1669171019796.png”,576.0, 480.0, 100.0)
mSet<-PlotKEGGPath(mSet, “Glycerophospholipid metabolism”,576, 480, “png”, NULL)
Table1. The Pathway_results analyzed by R
| Total | Expected | Hits | Raw p | -log10(p) | Holm adjust | FDR | Impact | |
|---|---|---|---|---|---|---|---|---|
| hsa00591 | 5 | 0.077419 | 1 | 0.075153 | 2.5882 | 1 | 1 | 0 |
| hsa00564 | 36 | 0.55742 | 2 | 0.10522 | 2.2517 | 1 | 1 | 0.19895 |
| hsa00592 | 13 | 0.20129 | 1 | 0.18426 | 1.6914 | 1 | 1 | 0 |
| hsa00563 | 14 | 0.21677 | 1 | 0.197 | 1.6246 | 1 | 1 | 0.00399 |
| hsa00561 | 16 | 0.24774 | 1 | 0.2219 | 1.5055 | 1 | 1 | 0.01402 |
| hsa00600 | 21 | 0.32516 | 1 | 0.28097 | 1.2695 | 1 | 1 | 0 |
| hsa00590 | 36 | 0.55742 | 1 | 0.4335 | 0.83587 | 1 | 1 | 0 |
| hsa00062 | 39 | 0.60387 | 1 | 0.46003 | 0.77646 | 1 | 1 | 0.01148 |
| hsa00071 | 39 | 0.60387 | 1 | 0.46003 | 0.77646 | 1 | 1 | 0.02355 |
| hsa00100 | 42 | 0.65032 | 1 | 0.48537 | 0.72284 | 1 | 1 | 0 |
| hsa00140 | 85 | 1.3161 | 1 | 0.74437 | 0.29521 | 1 | 1 | 0.00558 |
- The MetaboAnalyst online analysis:
| Total | Expected | Hits | Raw p | -log10(p) | Holm adjust | FDR | Impact | |
|---|---|---|---|---|---|---|---|---|
| Glycerophospholipid metabolism | 36 | 0.16 | 2 | 0.010239 | 2 | 0.9 | 0.86 | 0.2 |
| Linoleic acid metabolism | 5 | 0.02 | 1 | 0.022406 | 1.6 | 1 | 0.941 | 0 |
| alpha-Linolenic acid metabolism | 13 | 0.06 | 1 | 0.057361 | 1.2 | 1 | 1 | 0 |
| Glycosylphosphatidylinositol (GPI)-anchor biosynthesis | 14 | 0.06 | 1 | 0.061654 | 1.2 | 1 | 1 | 0 |
| Glycerolipid metabolism | 16 | 0.07 | 1 | 0.07019 | 1.2 | 1 | 1 | 0.01 |
| Sphingolipid metabolism | 21 | 0.09 | 1 | 0.091239 | 1 | 1 | 1 | 0 |
| Arachidonic acid metabolism | 36 | 0.16 | 1 | 0.15195 | 0.8 | 1 | 1 | 0 |
| Fatty acid elongation | 39 | 0.18 | 1 | 0.16367 | 0.8 | 1 | 1 | 0.01 |
| Fatty acid degradation | 39 | 0.18 | 1 | 0.16367 | 0.8 | 1 | 1 | 0.02 |
| Steroid biosynthesis | 42 | 0.19 | 1 | 0.17525 | 0.8 | 1 | 1 | 0 |
| Steroid hormone biosynthesis | 85 | 0.38 | 1 | 0.32671 | 0.5 | 1 | 1 | 0.01 |
For example:
In Table 1, hsa00564 is Glycerophospholipid metabolism, and its p value is 0.10522. However, the p value is 0.010239 in Table 2, which was analyzed by MetaboAnalyst online. The metabolite list is the same, but the p value is different. Why ?
