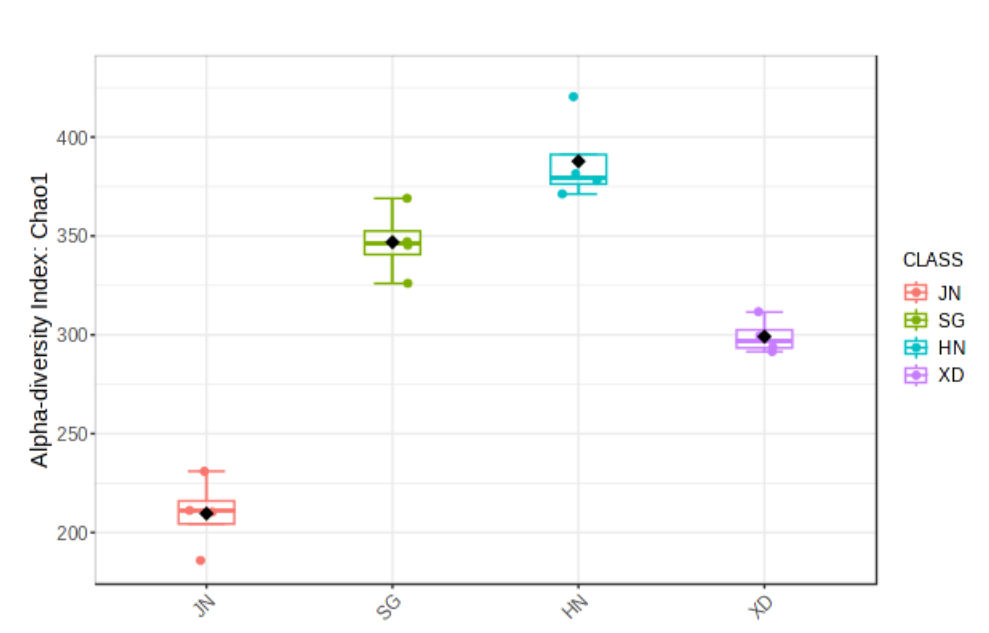
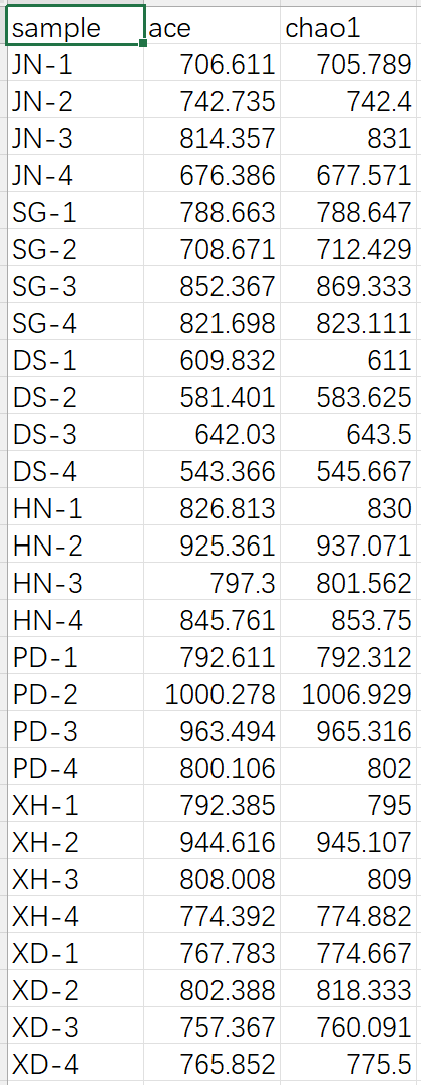
like the Chao1 value of JN in the first picture, it’s about 200, but calculate through R and asv_table, it’s above 600, why it different?
Please carefully read and follow our post guideline. How did you get those results exactly?
MicrobiomeAnalyst is a comprehensive platform with many data processing steps to make sure that the results are robust by following good practices (instead of the naive approach that performs R statistics directly on the original asv_table). You can view the detailed R command history for each steps before the statistical analysis, or follow our Nature Protocol