Hi,
I just finished running some data on Xplorer to analyze DEGs from the qPCR Ecotoxchip data, and I noticed that a lot of the adjusted p-values are the same across the different genes… Is this normal? Does this affect the data?
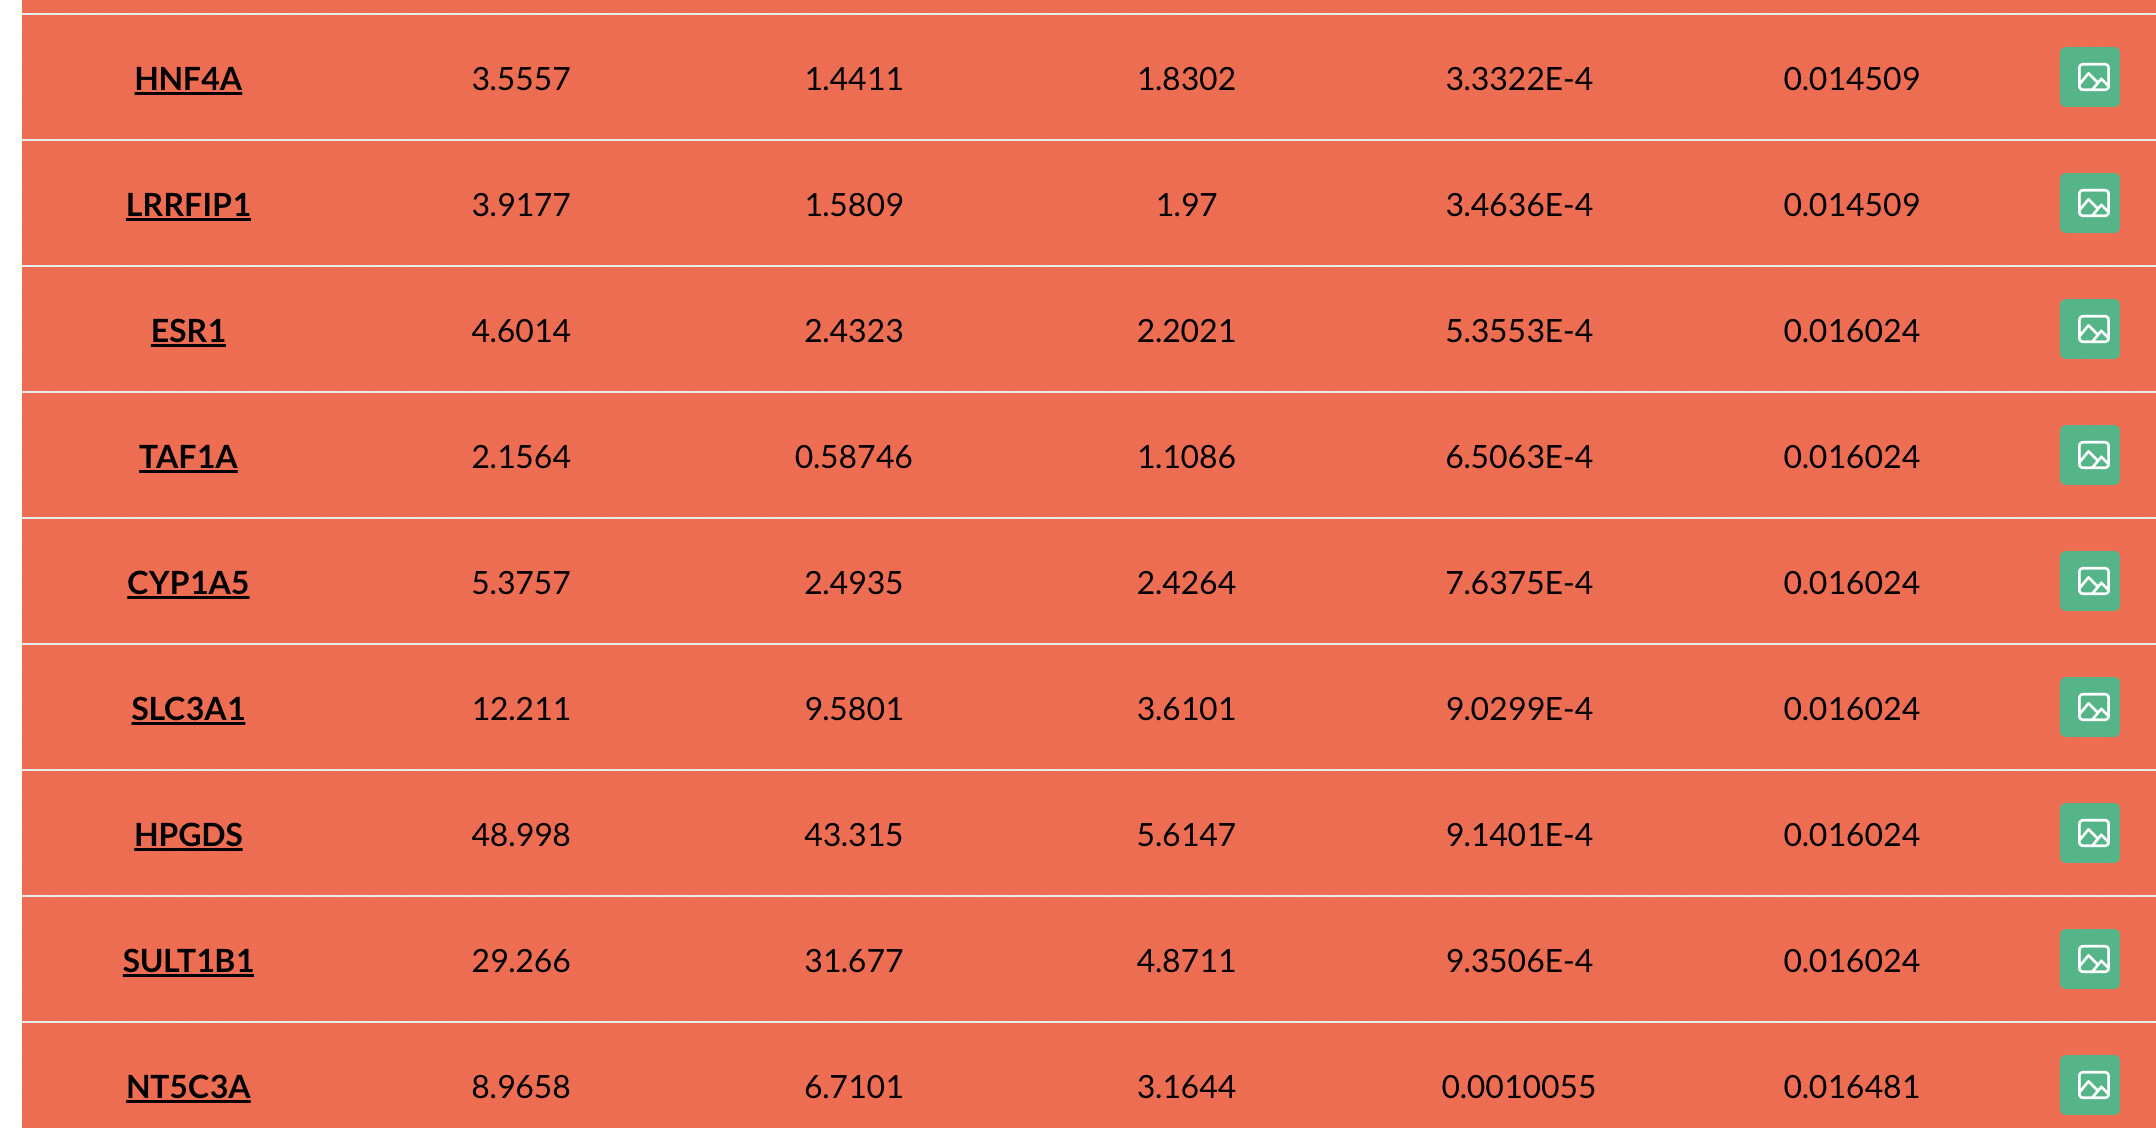
Please find attached one of the SigGene files and also screenshoots.
Yes, this is normal. The short answer - you do not need to be concerned about this and should ‘trust’ the adjusted values as they are.
Here’s a bit longer of an explanation. There are many different ways to adjust p-values.
The most strict is Bonferroni - to get this, you divide every p-value by the number of comparisons that you did (ie. the number of genes that you used for differential analysis). This guarantees that the probability that even one single significant result is a false positive is equal to your p-value cut-off (ie. 0.05 = 5% chance). It also gives one-to-one mapping between raw and adjusted p-values - you will clearly see the very small differences between raw p-values in the adjusted p-values because it is a simple division operation. We don’t use this for omics analysis because it is overly conservative. If we used Bonferroni, we would have very few DEGs and would have many false negatives.
The FDR method is more relaxed - instead of controlling the chance of detecting a single false positive, we set a % of false positives in our list of DEGs that we are ok with (typically 5%), and then adjust the p-values to achieve this false positive rate. Performing this type of adjustment is more complicated, and so most algorithms use some sort of parametric distributions to estimate the adjusted value. This results in some similar raw p-values being mapped to the same adjusted value.
You can read details here if you want to know more.