Hello everyone,
I am performing untargeted LC–MS analysis of samples containing a wide range of metabolites. My understanding is that peaks appearing at high retention times (RT) can sometimes result from column cleaning or late-eluting background compounds and therefore may not be suitable for downstream analysis.
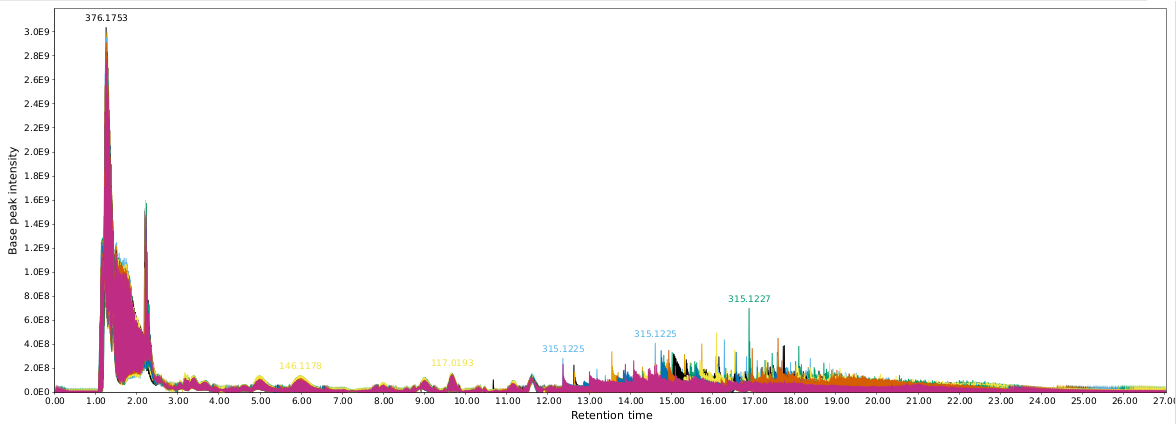
As shown in the figure I shared, which displays pooled QC samples (mixtures of all samples, injected repeatedly throughout the sequence to mitigate run-order or batch effects), the data were acquired in alternating polarity mode. In the positive-ion data, there is a series of high-intensity peaks appearing toward the end of the chromatogram. These peaks show large gaps in RT between injections, despite having very similar m/z values. Notably, their m/z values are also close to those of distinct peaks observed earlier in the run.
Could this pattern reflect a bench or run-order effect, or is it more likely related to column cleaning or late-eluting artifacts? In either case, would it be advisable to exclude this late-RT region from the analysis?
Thank you