I analysed some data for a project almost a year ago (Oct 24) using the one-factor analysis pipeline. I produced a volcano plot based on paired t tests, but I came back to edit them (flip the positive/negative responses) and was not able to reproduce the same analyses. I have a report saved from last time, whereby I had the following input parameters:
*Samples are in rows and features in columns The uploaded file is in comma separated values (.csv) format. The uploaded data sample contains 34 (samples) by 93 (compounds) data matrix.
*Zero or missing values were replaced by 1/5 of the min positive value for each variable.
No data filtering was performed.
*Row-wise normalization: N/A; Data transformation: N/A; Data scaling: Autoscaling.
Now, the missing value replacement function does not work, and the normalisation figures look quite different to the originals:
Original:
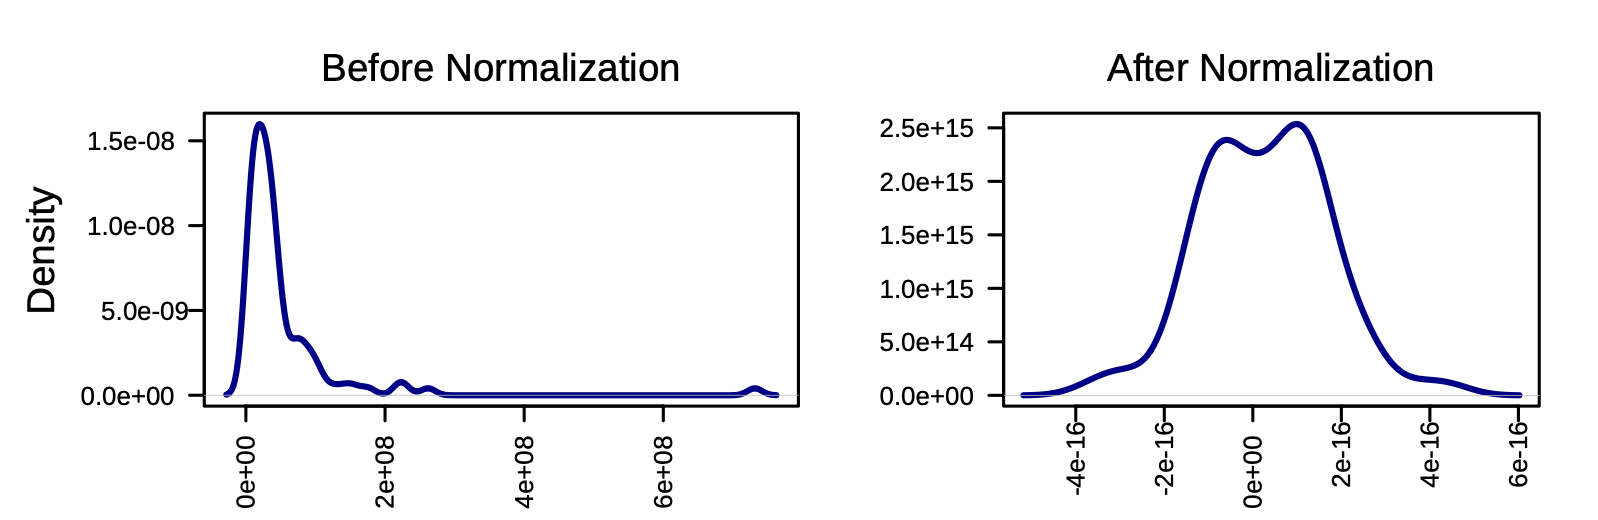
New attempt:
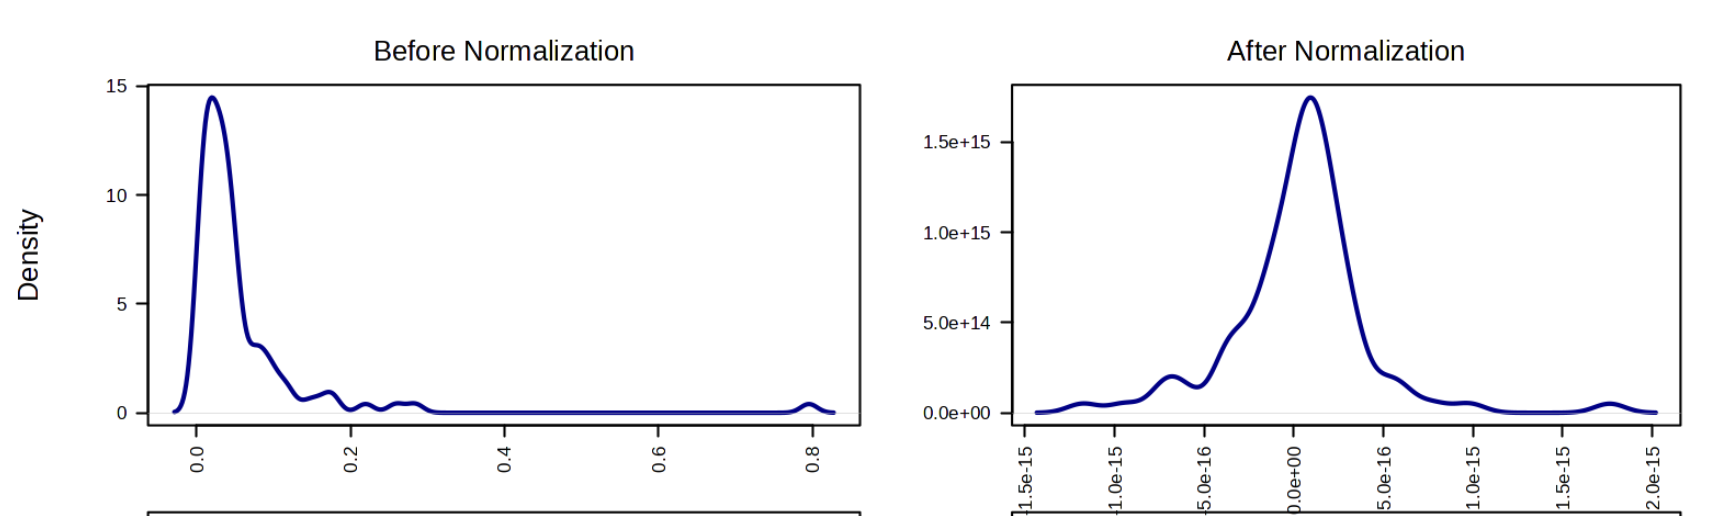
Does anyone know how I might be able to resolve this? The resulting volcano plots are a lot more bunched with much more severe extremes than previously, and I’m not even sure if its only the missing data handling that would explain this - though I can’t work out what else could have changed in the pipeline.
Thanks in advance…