I would like to change the order of my sample groups in this heatmap:
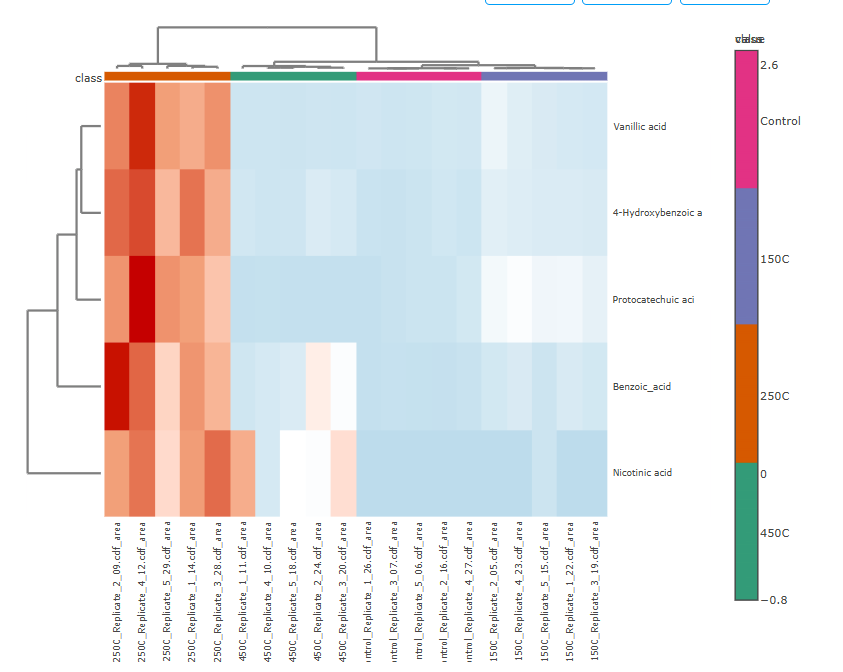
Specifically, I would like the order of the groups to be “control” → “150C” → “250C” → “450C” rather than what is presented currently (“250C” → “450C” → “Control” → “150C”).
I’ve tried changing the order using the “Data editor” => “Group Editor”, but that didn’t seem to work.
Here’s some more information:
1). Tool and module used: I used the “Heatmaps” tool within the “Statistical Analysis [one factor]” module.
2). I have attached a copy of the data to this post.
Practice_metaboanalyst_data.csv (2.5 KB)
3). I selected the csv file with samples in rows (unpaired), didn’t filter the data, and didn’t normalize the data.
4). This post does not relate to using R packages.
5). These data are LC-MS untargeted analysis data for soil-water extracts. The data were exported from mzmine.