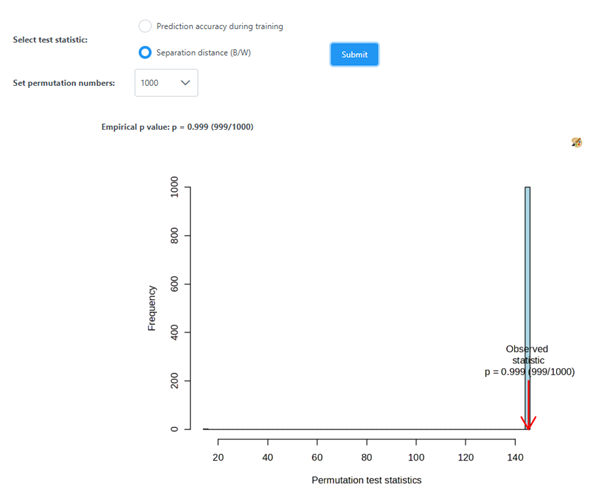
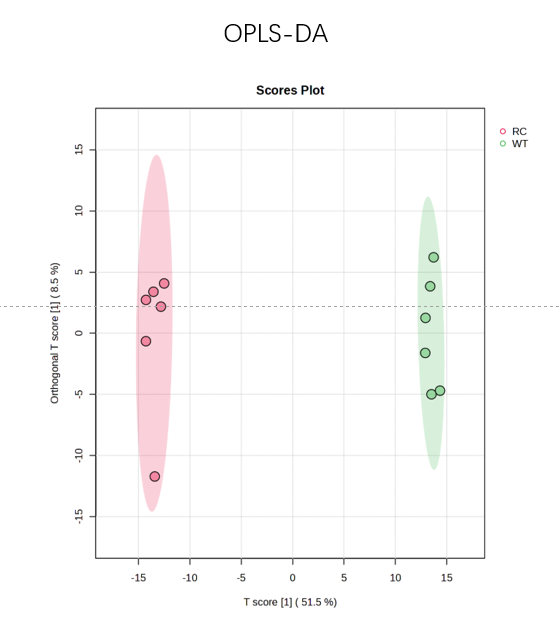
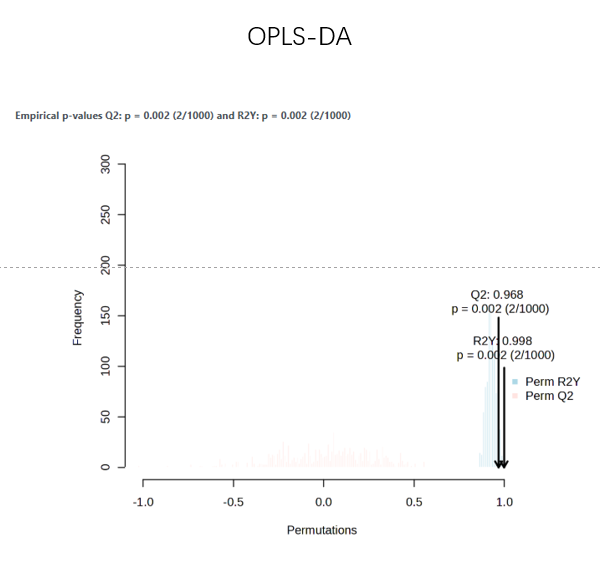
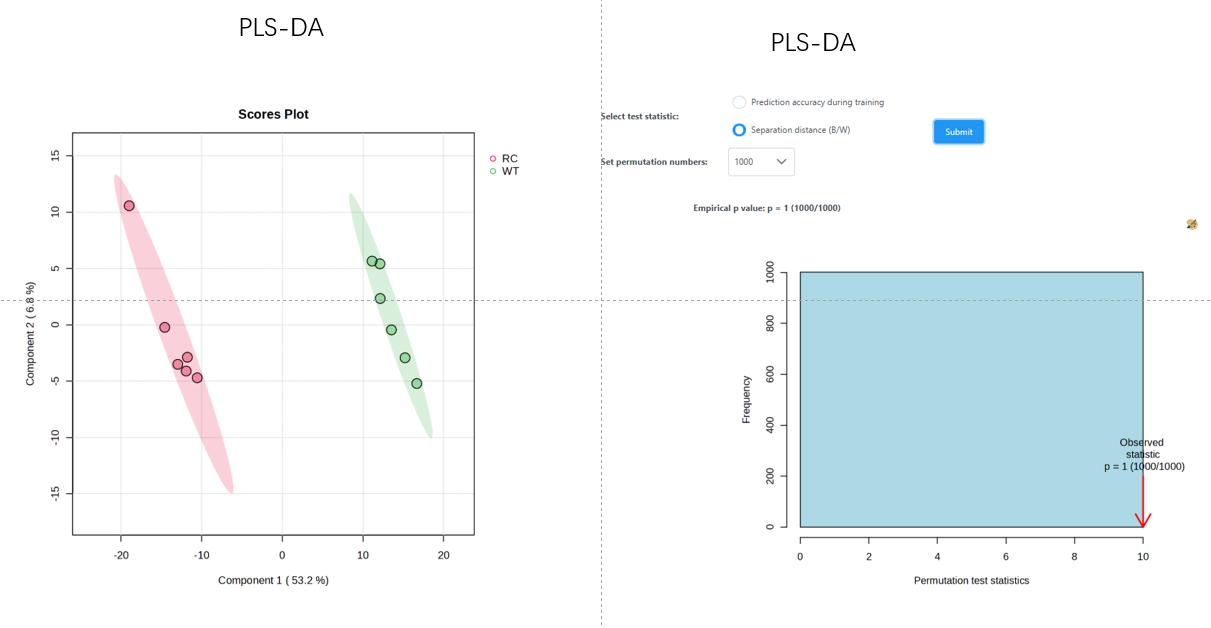
In the past few months, I have been running PLS-DA permutation tests, but the resulting P-values are always incorrect. Although the three groups are clearly separated, the permutation P-value for PLS-DA is close to 1, which is unreasonable. To verify this potential issue, I selected two groups with significant differences and performed both OPLS-DA and PLS-DA. The OPLS-DA model showed a complete separation with a P-value of 0.002, whereas the PLS-DA model also separated the groups but yielded a P-value of 1. Why is this happening?
This is a good example of PLS-DA tend to overfitt especially when sample sizes are small and feature size are large. Classification or in general ML methods usually require at least ~20 samples / group to be robust
With your sample size => univariate (t-test/ANOVA), PCA and heatmap.
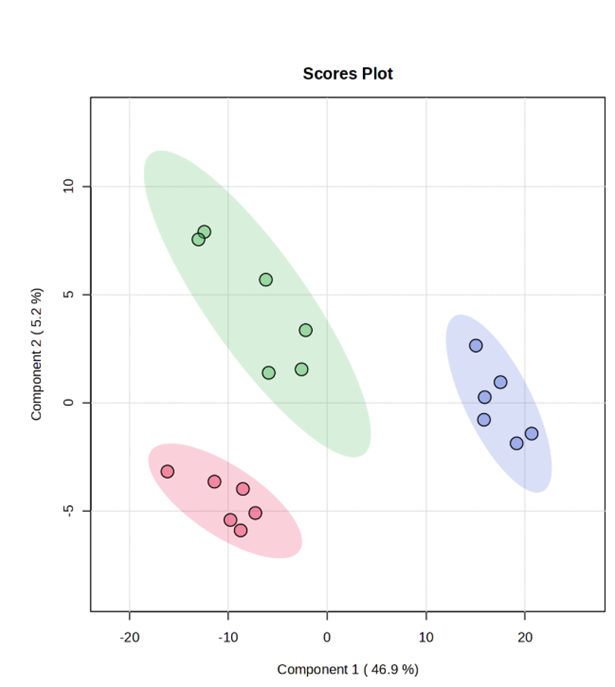
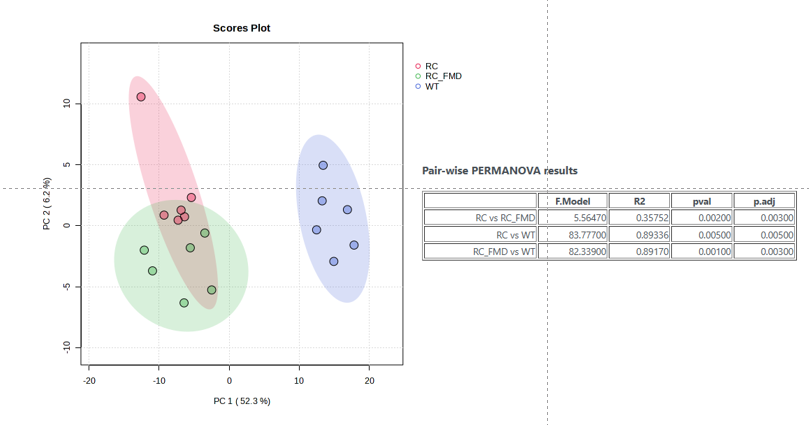
Thank you for your reply. The PCA results show that the three groups can be clearly separated with statistical significance. Theoretically, the P-value of PLS-DA should not be close to 1, right? Last year, I performed a similar analysis with the same sample size, and the PLS-DA P-value was normal, less than 0.05. Could there be other reasons for this discrepancy?
PCA patterns p values evaluate signficance of the pattern for this particular data
PLS-DA p values evaluate signficance/confidence of the model in predicting (new data)… this requires a large sample size - as it must capture the generalizable patterns / rules