Hi,
I am analyzing a lipidomics dataset using MetaboAnalystR 4.0 and OptiLCMS R packages locally. We had DDA MS1 files and went through the section 2. Example raw spectral data processing (MS1) in your tutorial
(LC-MS/MS Raw Spectral Data Processing)
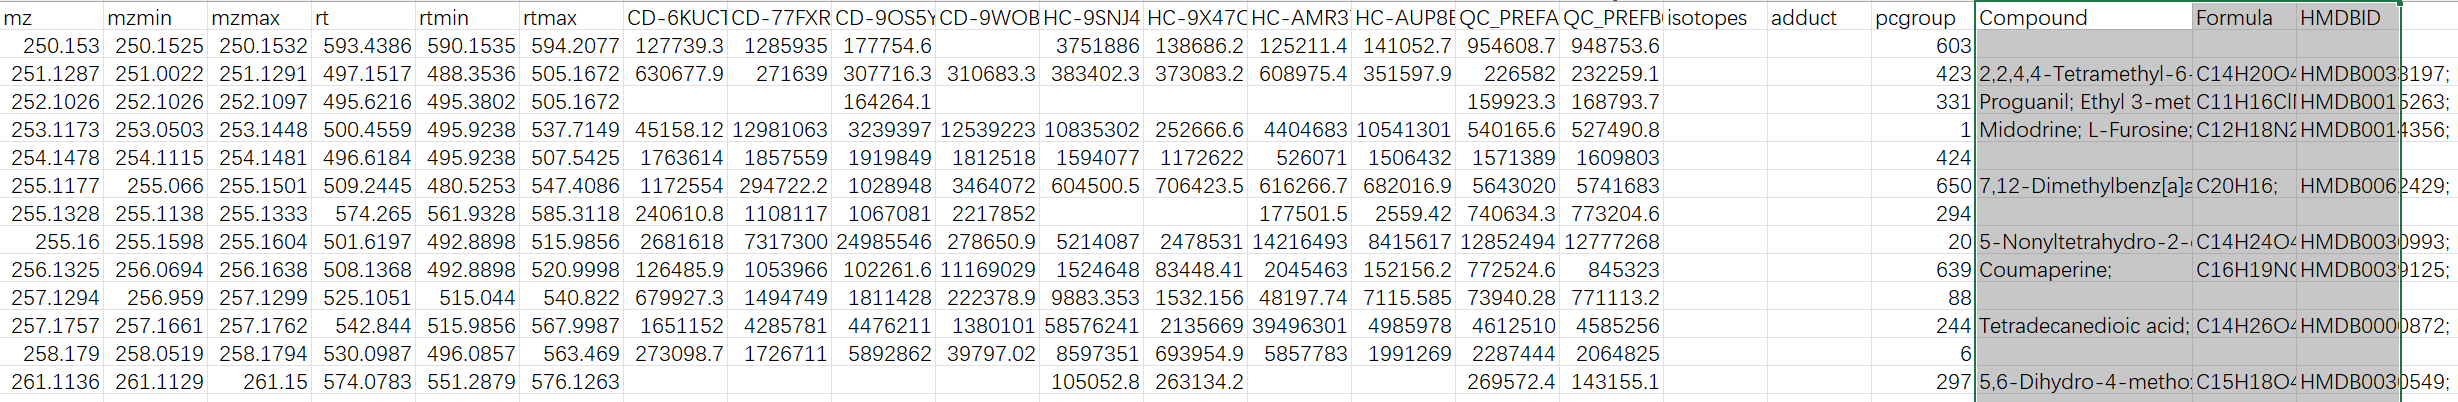
We tried your example raw file (A small example dataset for demo purposes, containing 10 spectra (UPLC-Q/E-ESI-, C18) organized into three groups (Healthy, Crohn’s Disease and QC) from [Lloyd-Price et al.]) and it works successfully with peak_feature_summary with putative compound ID in your online webpage interface.
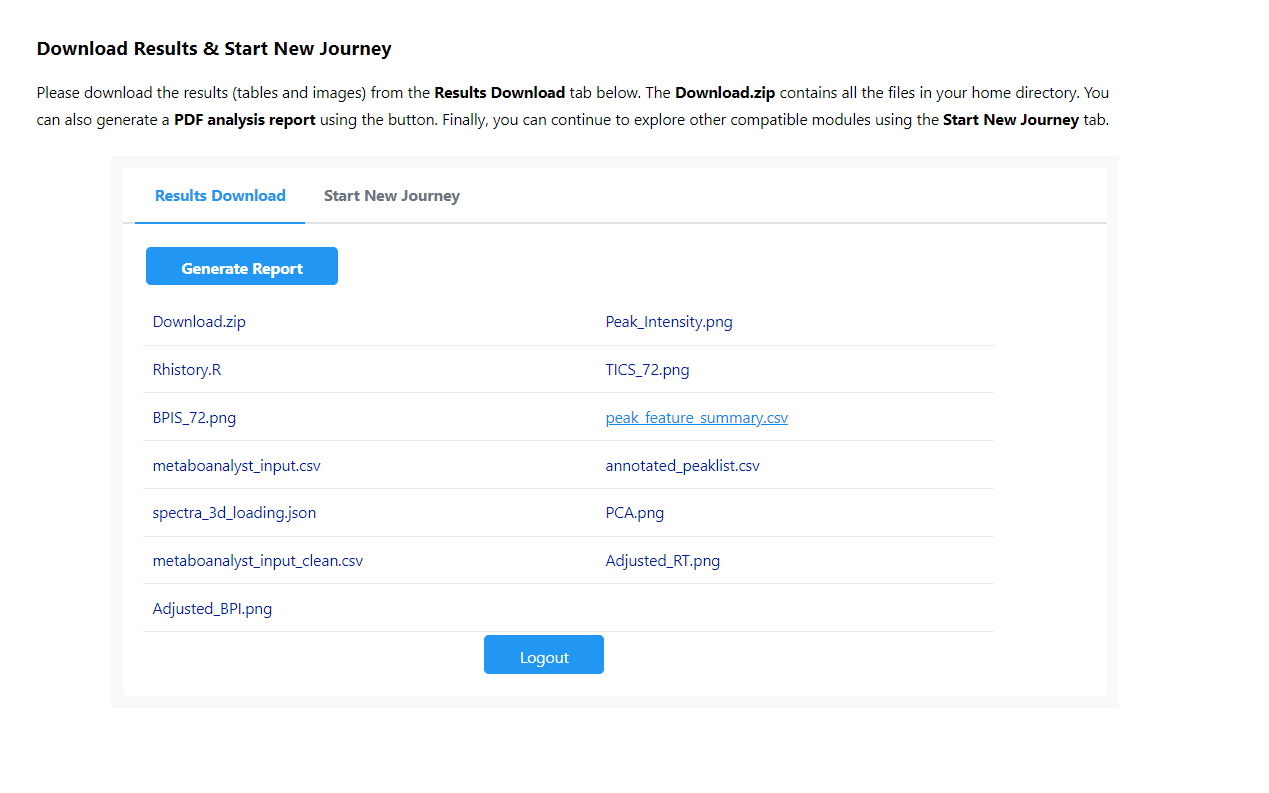
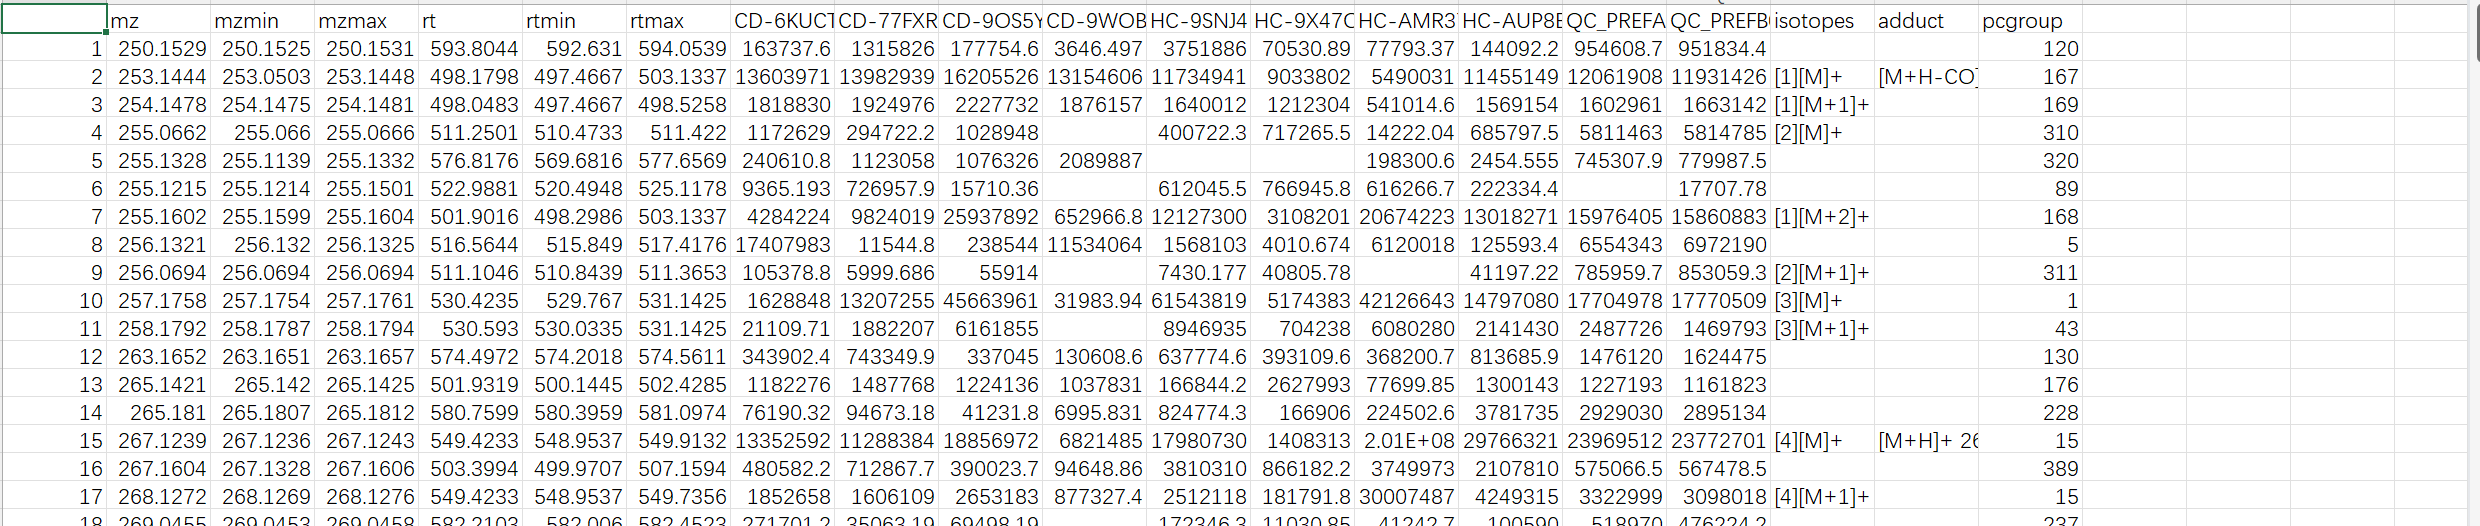
However, when we tried our raw data after local R implementation, we could only export files: metaboanalyst_input, peak_intensity and peak_result_summary, no peak_feature_summary with putative compound ID.
I checked our R script with your script in the webpage dealing with example file and did not find much differences.
This is our script for your reference. Basically we are copying your tutorial.
library(MetaboAnalystR)
library(OptiLCMS)
DataFiles ← list.files(“3d/QC/”, full.names = TRUE)
mSet ← PerformROIExtraction(datapath = DataFiles, rt.idx = 0.9, rmConts = TRUE)
#use automatic optimization 140min 6 cores use 6XLKKM3 workstation
best_params ← PerformParamsOptimization(mSet, param = SetPeakParam(platform = “UPLC-Q/TOF”), ncore = 6)
mSet ← ImportRawMSData(path = c(“3d”), plotSettings = SetPlotParam(Plot = T))
mSet ← PerformPeakProfiling(mSet, Params = best_params, plotSettings = SetPlotParam(Plot=TRUE))
annParams ← SetAnnotationParam(polarity = ‘positive’, mz_abs_add = 0.001); #mz_abs_add depends on best_parameters
mSet ← PerformPeakAnnotation(mSet, annParams)
mSet ← FormatPeakList(mSet, annParams, filtIso = FALSE, filtAdducts = FALSE, missPercent = 1);
Export.Annotation(mSet);
Export.PeakTable(mSet);
Export.PeakSummary(mSet)