Hello,
I am experiencing an issue with the confidence ellipses in the PCA scores plot. The ellipses are not displayed correctly for all groups, even though the samples are correctly identified and colored in the plot.
1. Tool and module
-
Tool: MetaboAnalyst web platform
-
Module: Statistical Analysis – One Factor
-
Analysis: Principal Component Analysis (PCA)
-
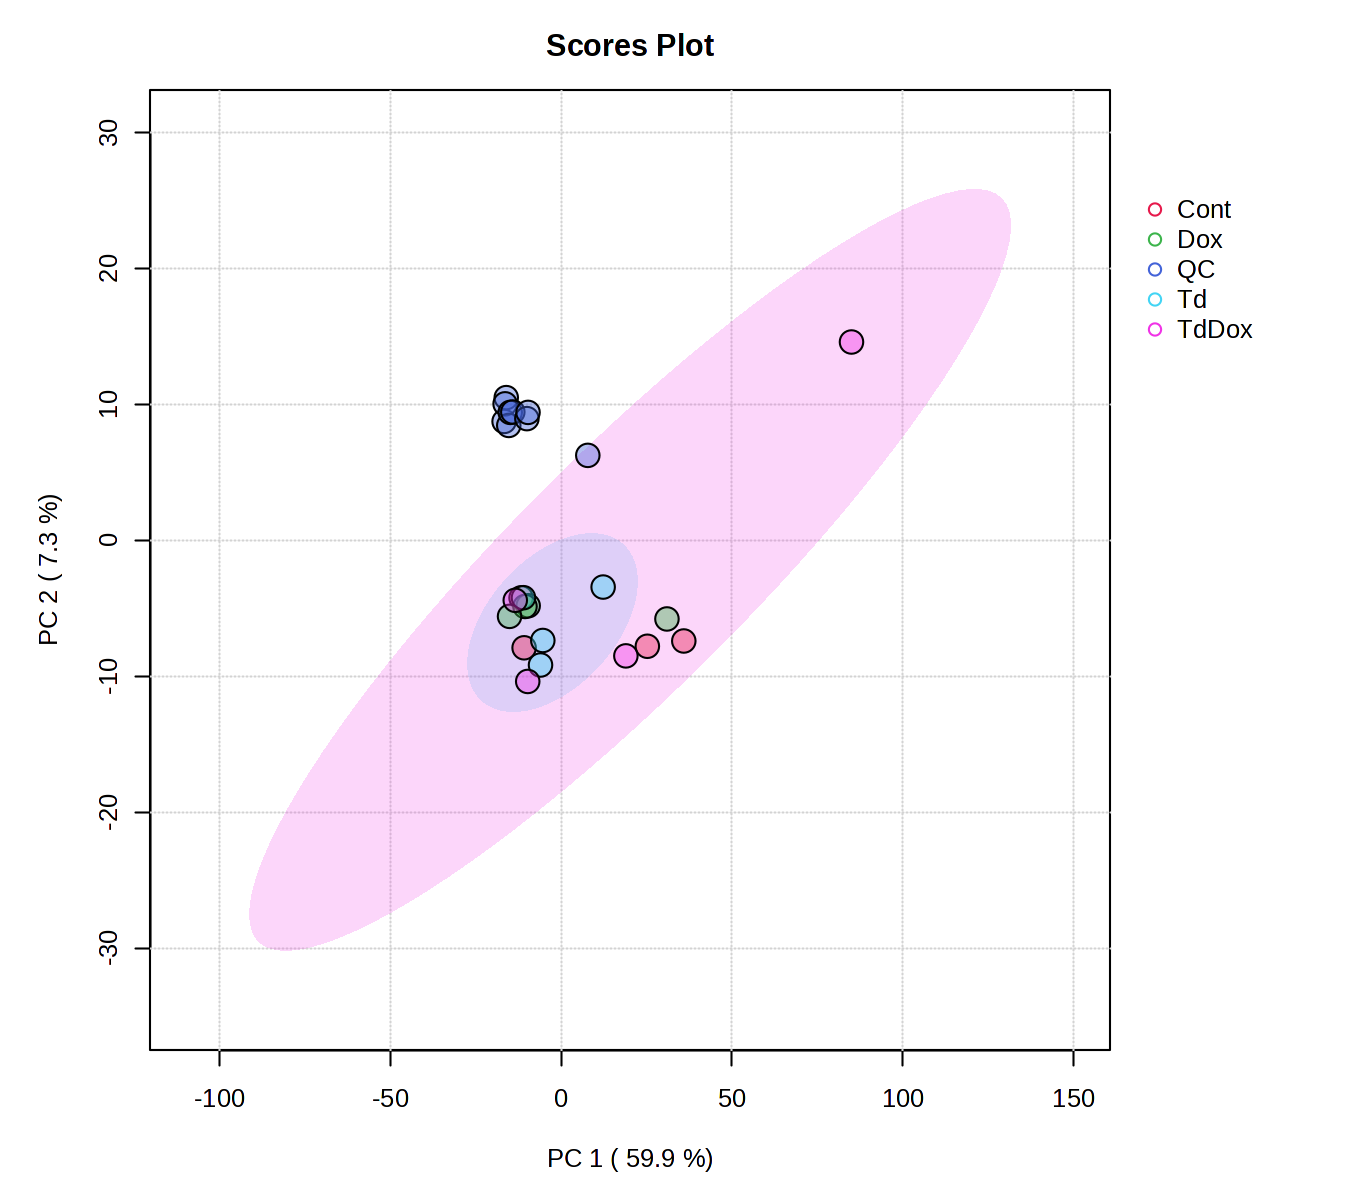
Plot: 2D Scores Plot, PC1 versus PC2
2. Data
The input is a processed feature-intensity table from an untargeted LC–MS metabolomics experiment. I will attach the exact data file uploaded to MetaboAnalyst.
All.csv (510.5 KB)
The dataset contains 25 samples divided into five groups with 4 samples each, and pooled quality-control samples, QC n = 9.
The data were acquired by UHPLC–Orbitrap–MS/MS in negative electrospray ionization mode. This is not a raw-data-processing issue; the feature-intensity matrix was processed before being uploaded to MetaboAnalyst.
3. Steps leading to the issue
-
I opened the Statistical Analysis – One Factor module.
-
I uploaded the attached feature-intensity table.
-
The samples were assigned to the five groups listed above.
-
The data passed the integrity check.
-
I applied the following processing options:
-
Missing-value treatment: KNN (feature-wise)
-
Data filtering: Low-quality filter: Remove features with > 65; Low-repeatability filter:RSDs greater than: 30%
-
Sample normalization: none
-
Data transformation: log 10 transformation
-
Data scaling: autoscaling
-
-
I opened the PCA results.
-
I selected the 2D scores plot using PC1 and PC2 and enabled the confidence ellipses.
-
I generated the attached plot.
4. Observed result
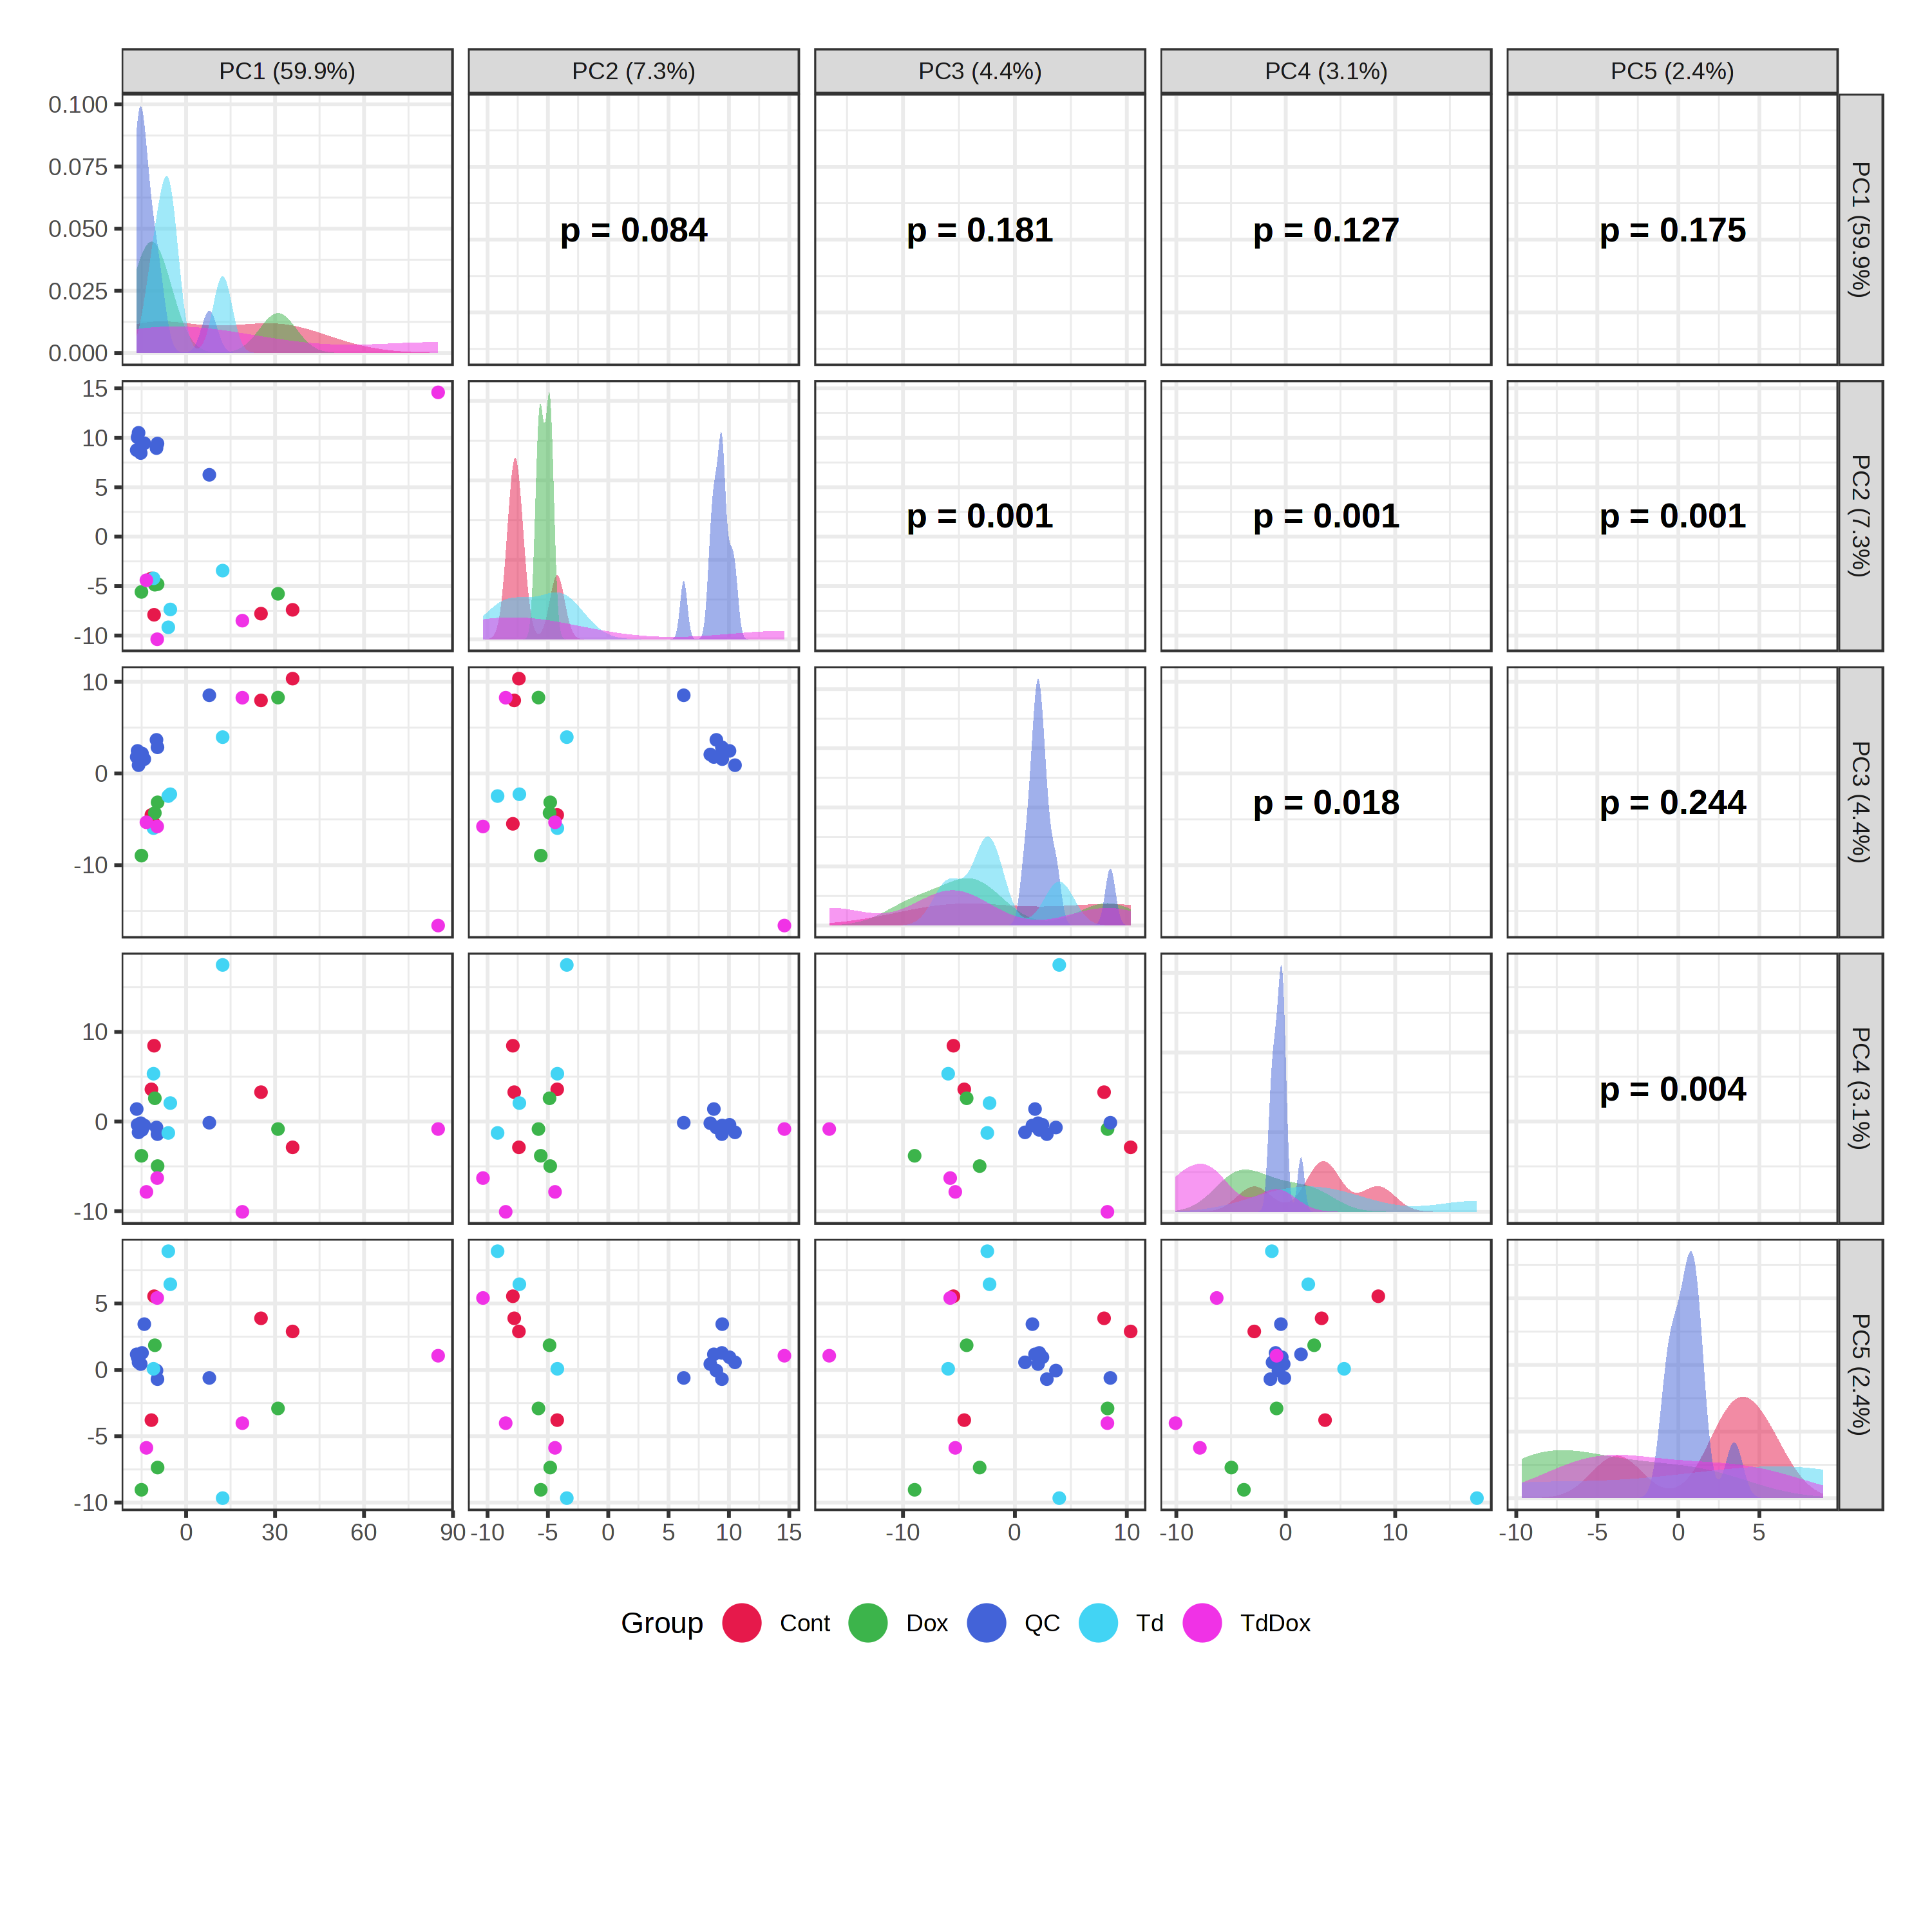
PC1 and PC2 explain 59.9% and 7.3% of the variance, respectively. The sample points and group colors appear correctly, but separate confidence ellipses are not displayed for all five groups.
Only two shaded regions are clearly visible. In particular, the QC samples form a tight and visually distinct cluster around PC1 ≈ −15 and PC2 ≈ 9, but no confidence ellipse is drawn around this cluster. The ellipses for some of the biological groups are also missing, overlapping incorrectly, or cannot be distinguished.
No error or warning message is displayed when the plot is generated.
5. Expected result
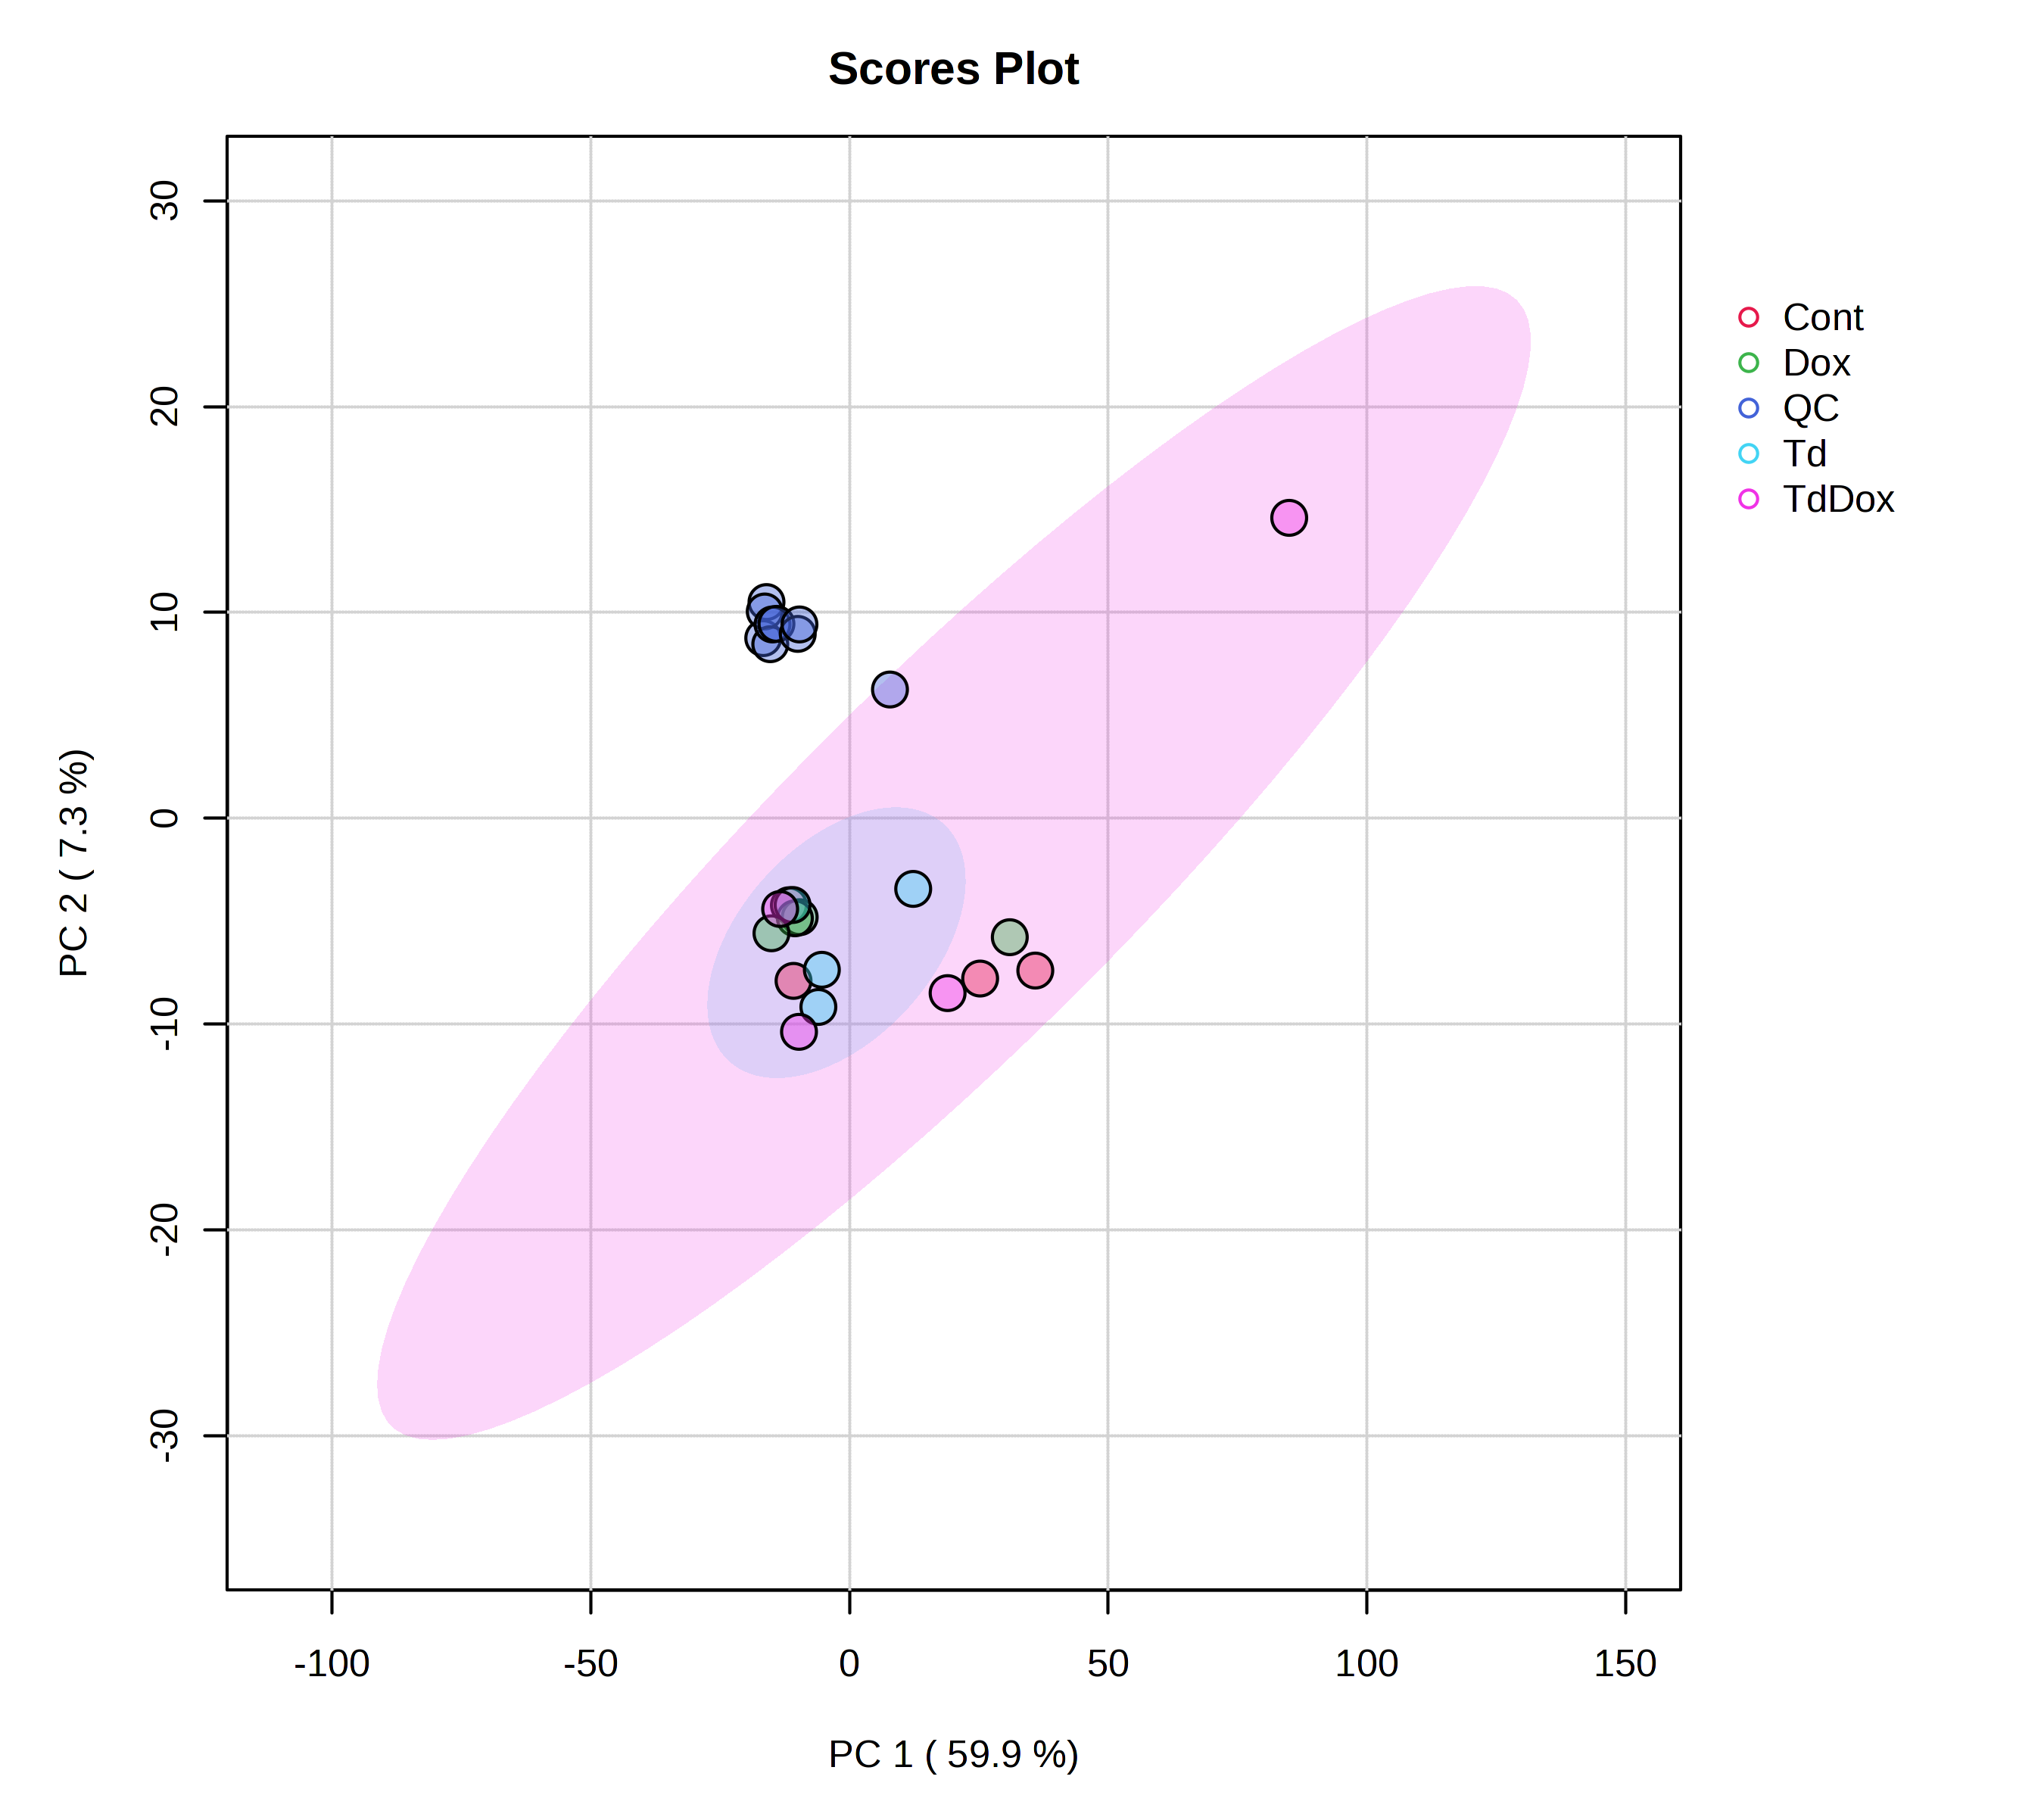
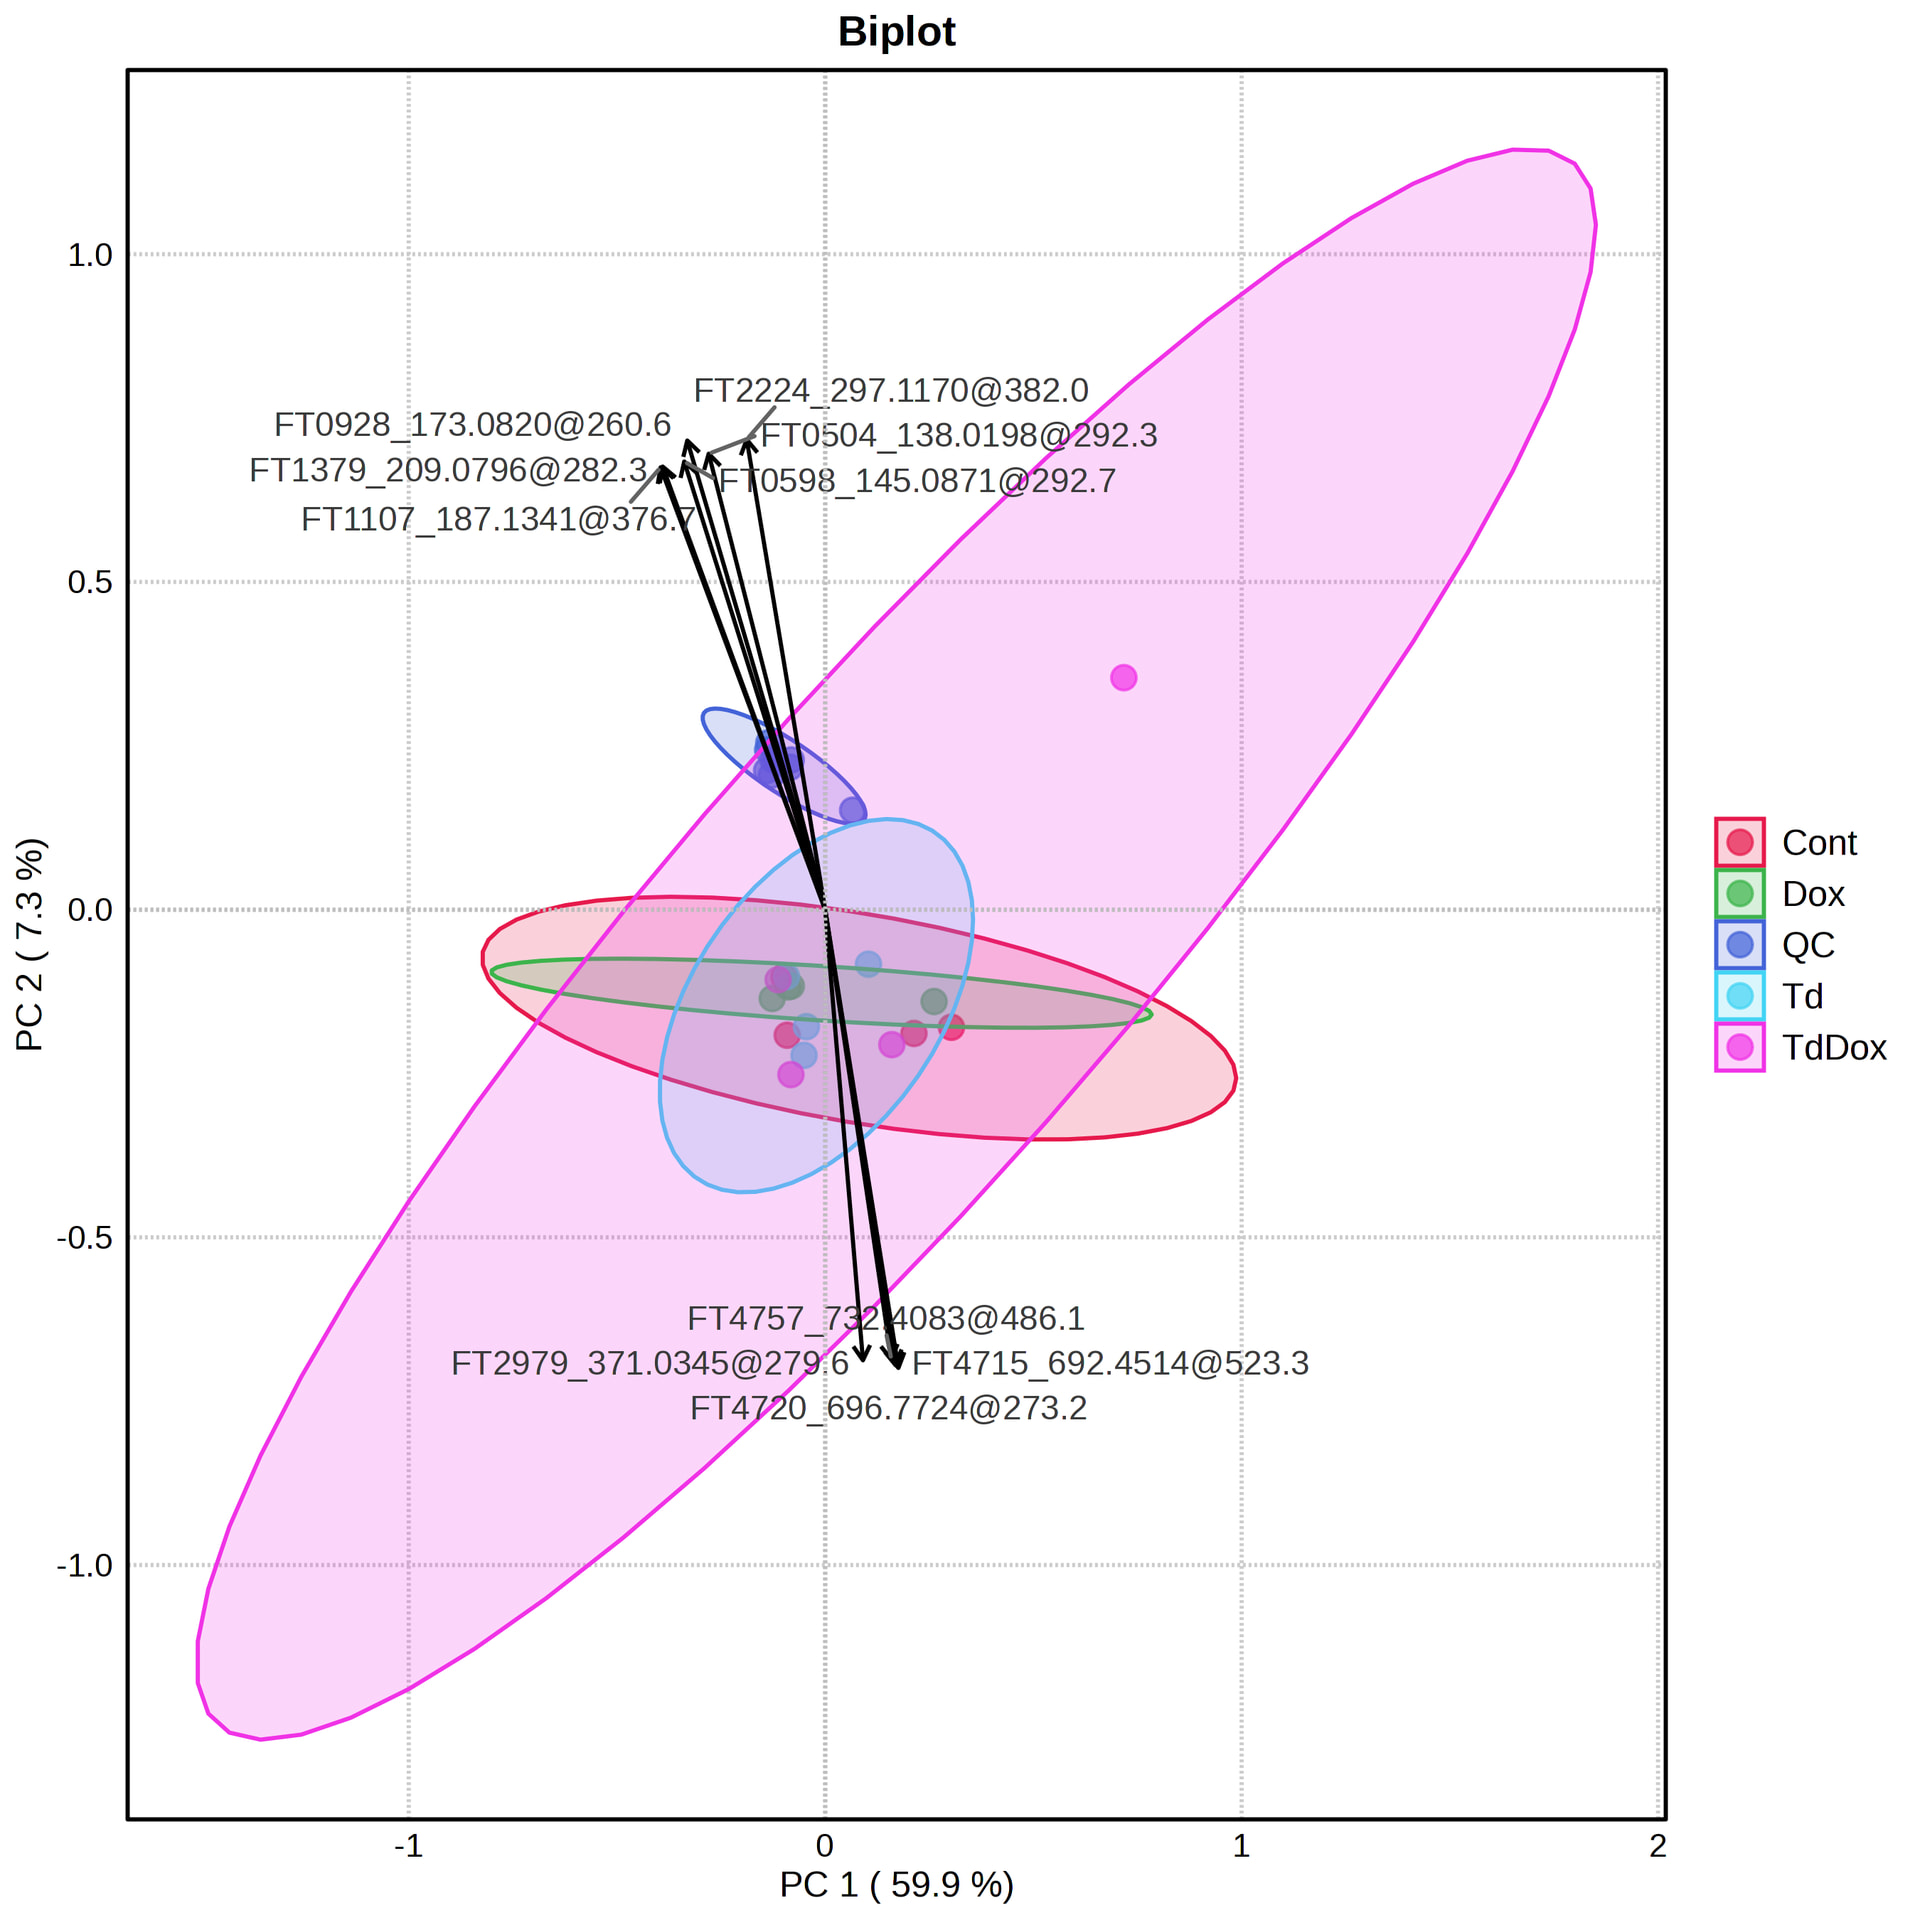
I expected one confidence ellipse for each group for which the ellipse can be mathematically calculated. Since each biological group has four replicates and the QC group has nine samples, I would like to know whether the missing ellipses are caused by:
-
a minimum sample-size requirement;
-
a singular or near-singular within-group covariance matrix;
-
overlapping ellipses;
-
or a plotting issue in MetaboAnalyst.
Could you please try to reproduce the issue using the attached data file and clarify why the QC ellipse and some of the group ellipses are not displayed?
Thank you.