Hi,
I am running an analysis among 3 treatments (d5 vs. d10 vs. d15), however I am not being able to visualize the p-value of specific contrasts comparisons (for example, results from d5 vs. d10, or results from d5 vs. d10).
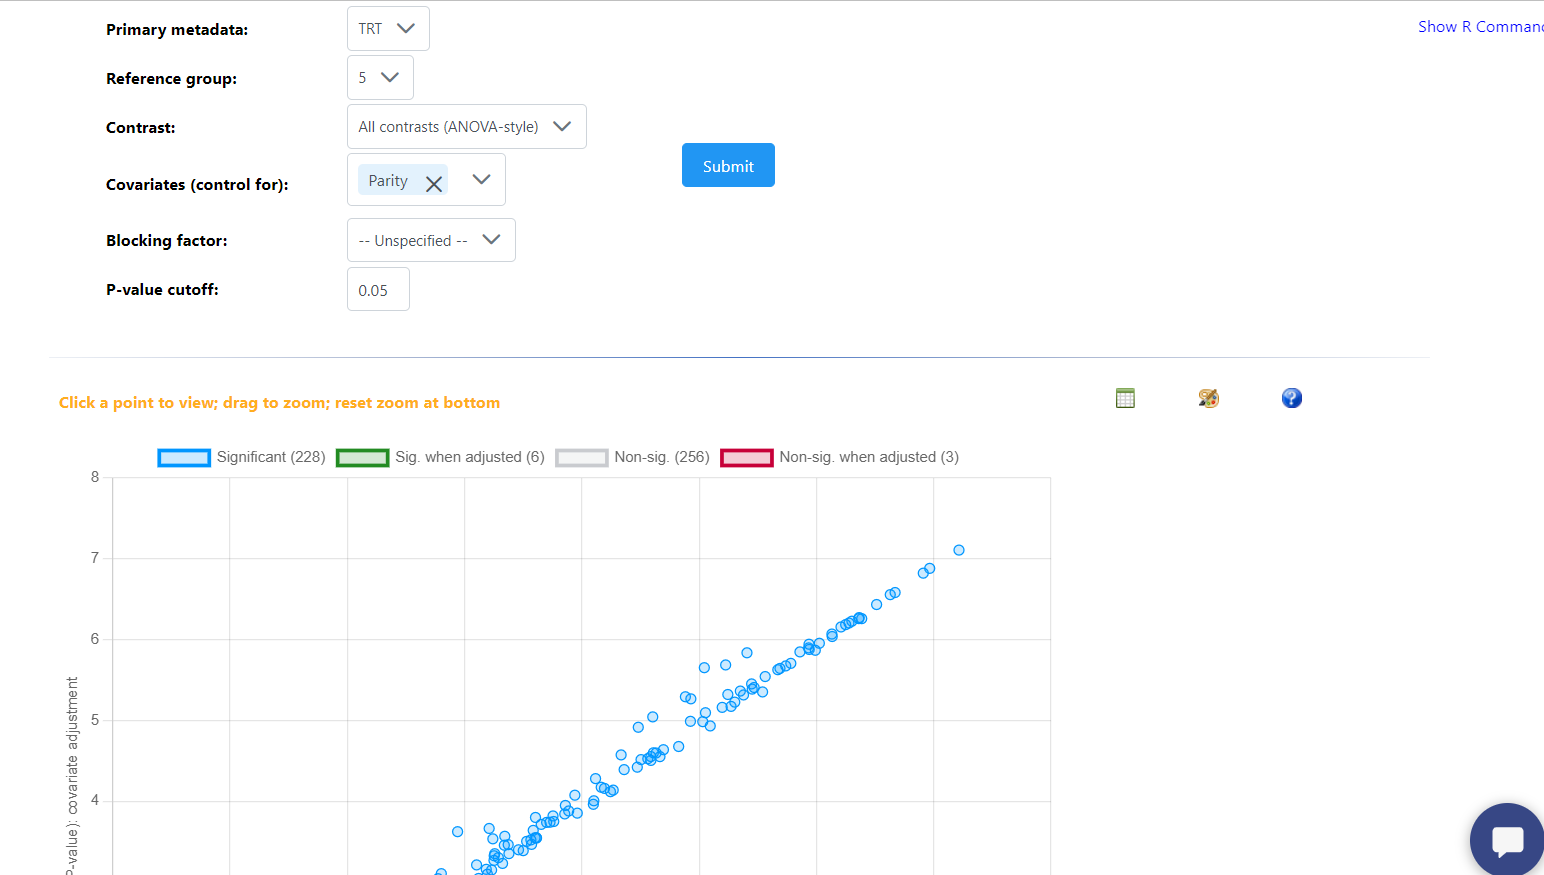
I understand that 238 features are statistically different (as shown in picture 1), but when I try single analysis comparing two factors, I am not able to detect any differences.
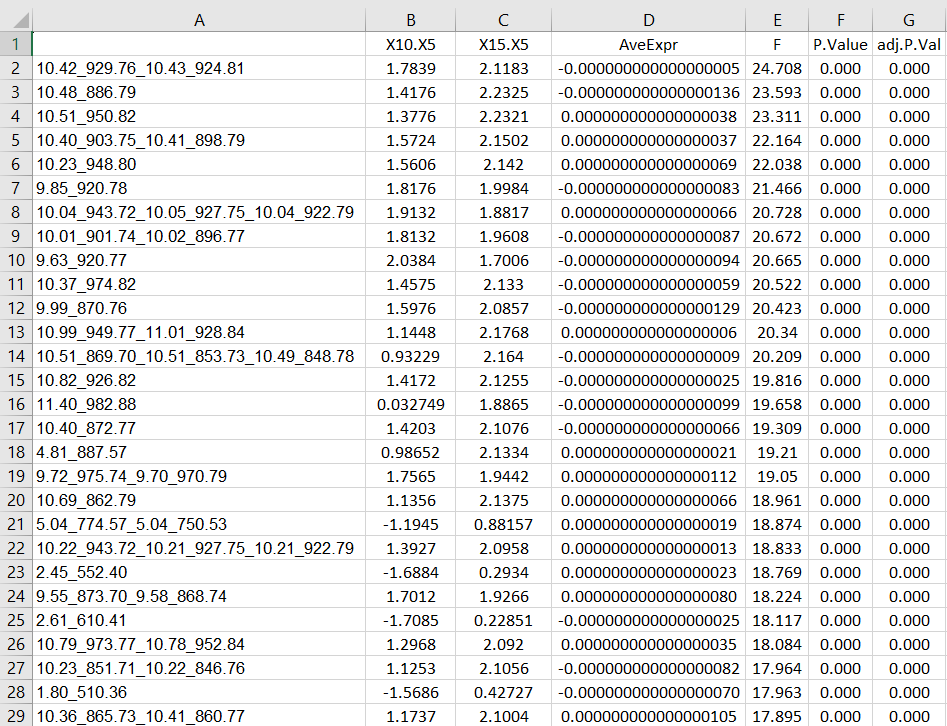
Then, when I look the data, I am not able to separate the results from the first contrast comparison (d5 vs. d10) and the second contrast (d5 vs. d10). I only have 1 general p-value (as shown in picture 2).
Question 1: Is it possible to obtain the p-values for each contrast?
Question 2: Is it possible to obtain results from all comparisons? For example, d5 vs. d10, and d5 vs. d15, and D10 VS. D15 (this one is not included because of the reference group item).
Thank you.