I encountered this problem today (05/20/24).
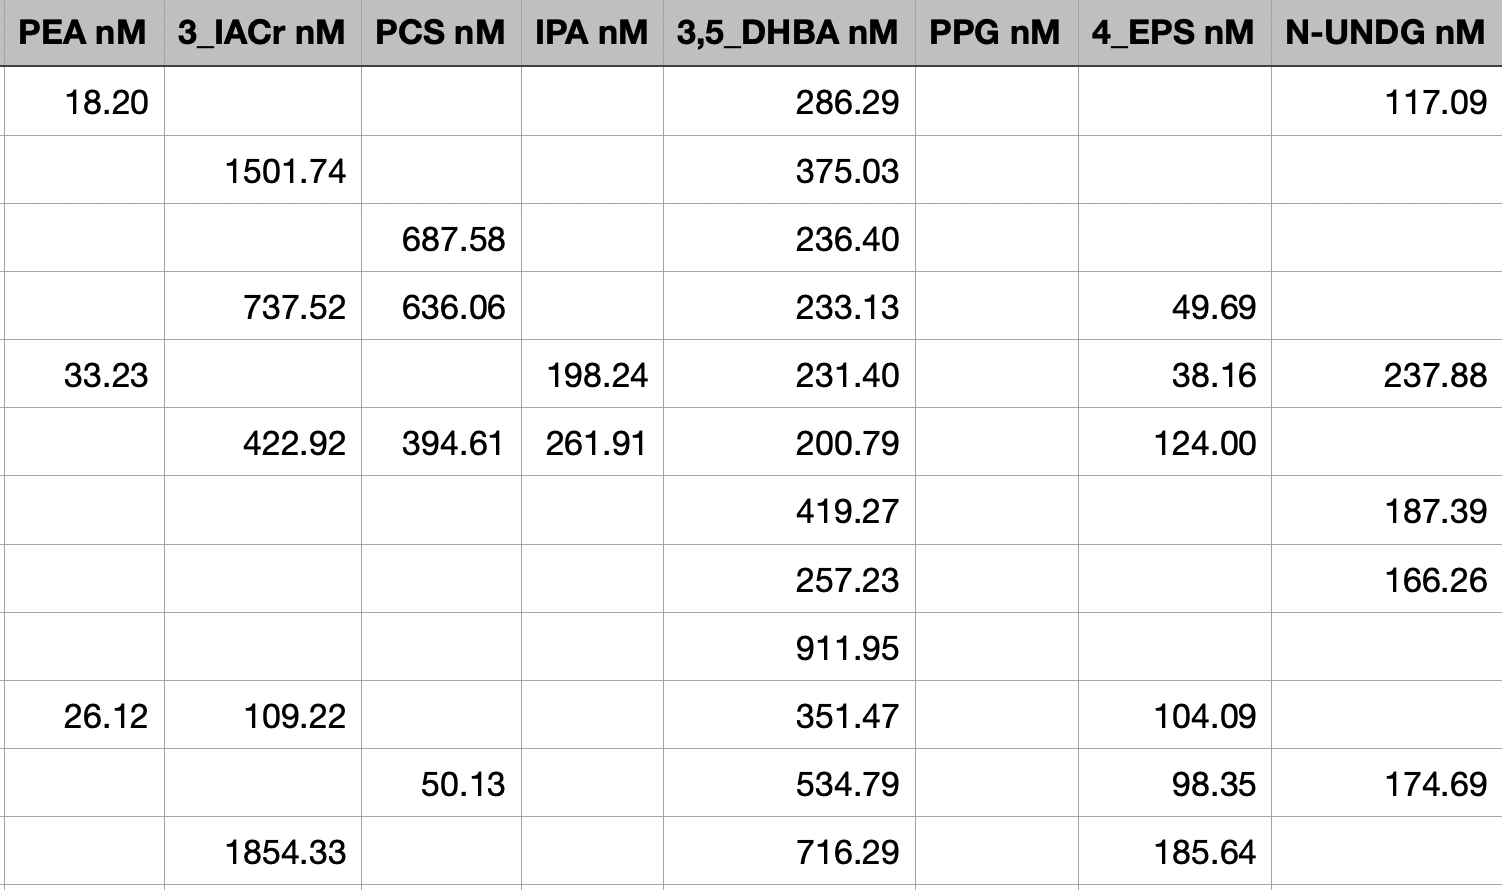
I submitted a CSV data set
10d.csv (8.9 KB)
↓
Statistical Analysis “one factor”
↓
The data passed muster.
↓
Normalization by median
Log transformation (base 10)
Pareto scaling
↓
Two-sample t-tests & Wilcoxon rank-sum tests, unequal variance, use Raw data
↓
Problem 1: 6 significant features were detected. Normally, when I use my cursor to select a significant feature ( purple circle), the name of the feature pops up. However, for the 5 features on the R side of the display, only a black arrow pointing to the purple circle appears appears .
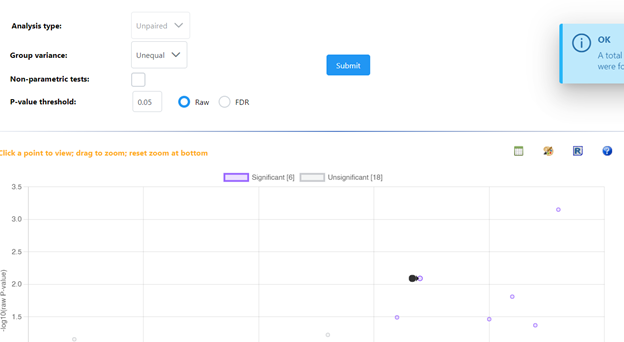
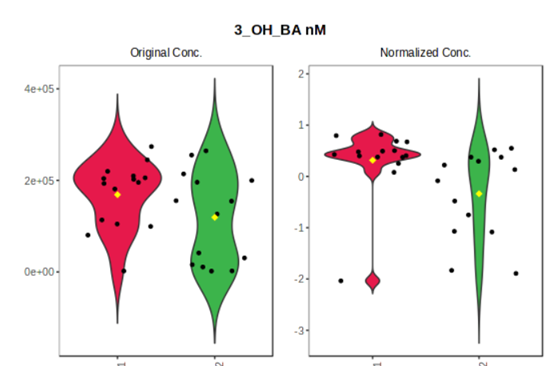
When I click on the purple circle, the Feature View menu appears. At the top of Feature View, the name of the feature appears (in this case 3OH_BA_nm)
Question 1: why doesn’t the name of the feature immediately appear)
Problem 2: When I select a different significant feature (different purple circle), the name of the feature immediately appears. In my case it is “3_HPPA”,
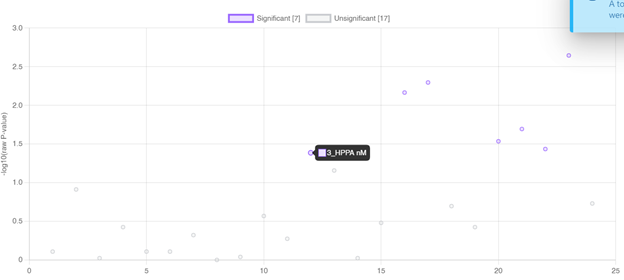
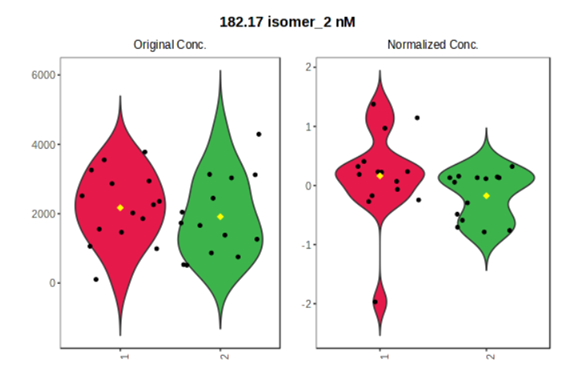
However, when I click on that purple circle, the Feature View for a different feature (In this case 182.17 isomer_2nM) appears.
Q: Why the discrepancy?