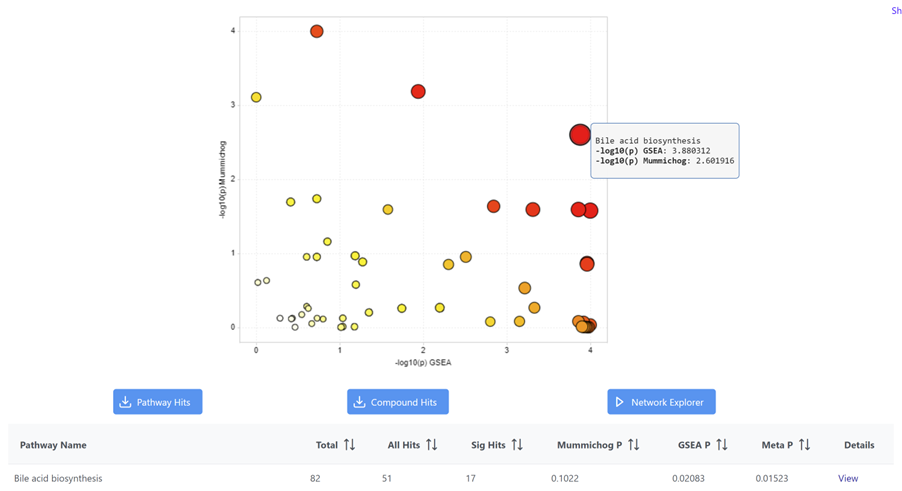
I encountered some issue when using ‘MetaboAnalyst5.0’ to do functional analysis(Input data type ‘MS peaks’), it seems like the -log10(P-value) showed on the graph does not match the mummichog p and GSEA P in the table below, this issue exists for the datasets of my own and also with the example datasets from the website. I attached the results of using one of the example data(IBD). For example, the graph shows -log10(p) for mummichog is 2.6, but from the table, mummichog p-value is 0.1022, -log10(0.1022)=0.9905.
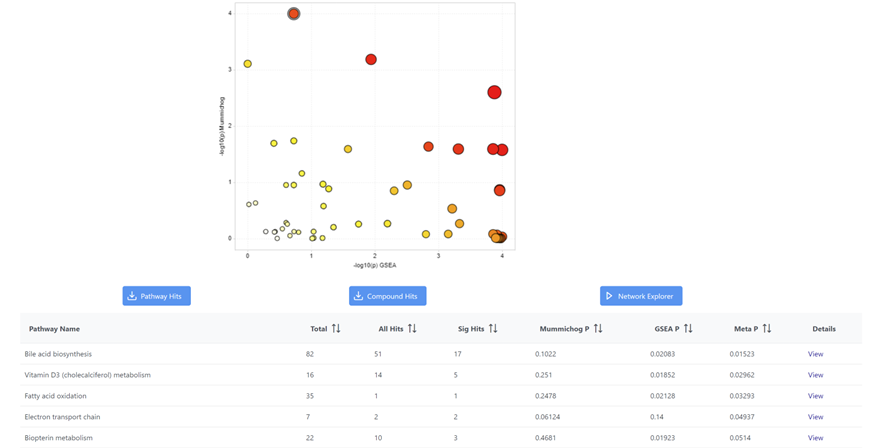
This p-value issue only happens if I choose ‘Mummichog’ and ‘GSEA’ at the same time in the “set parameter” step, if I choose only one of them to run the analysis, the p-value matches the -log10 in the graph. Are the p-value transformed in some way before log transformation when using both mummichog and GSEA?