Fold change is used to reflect biological response - the consideration here is what are true biological measures.
-
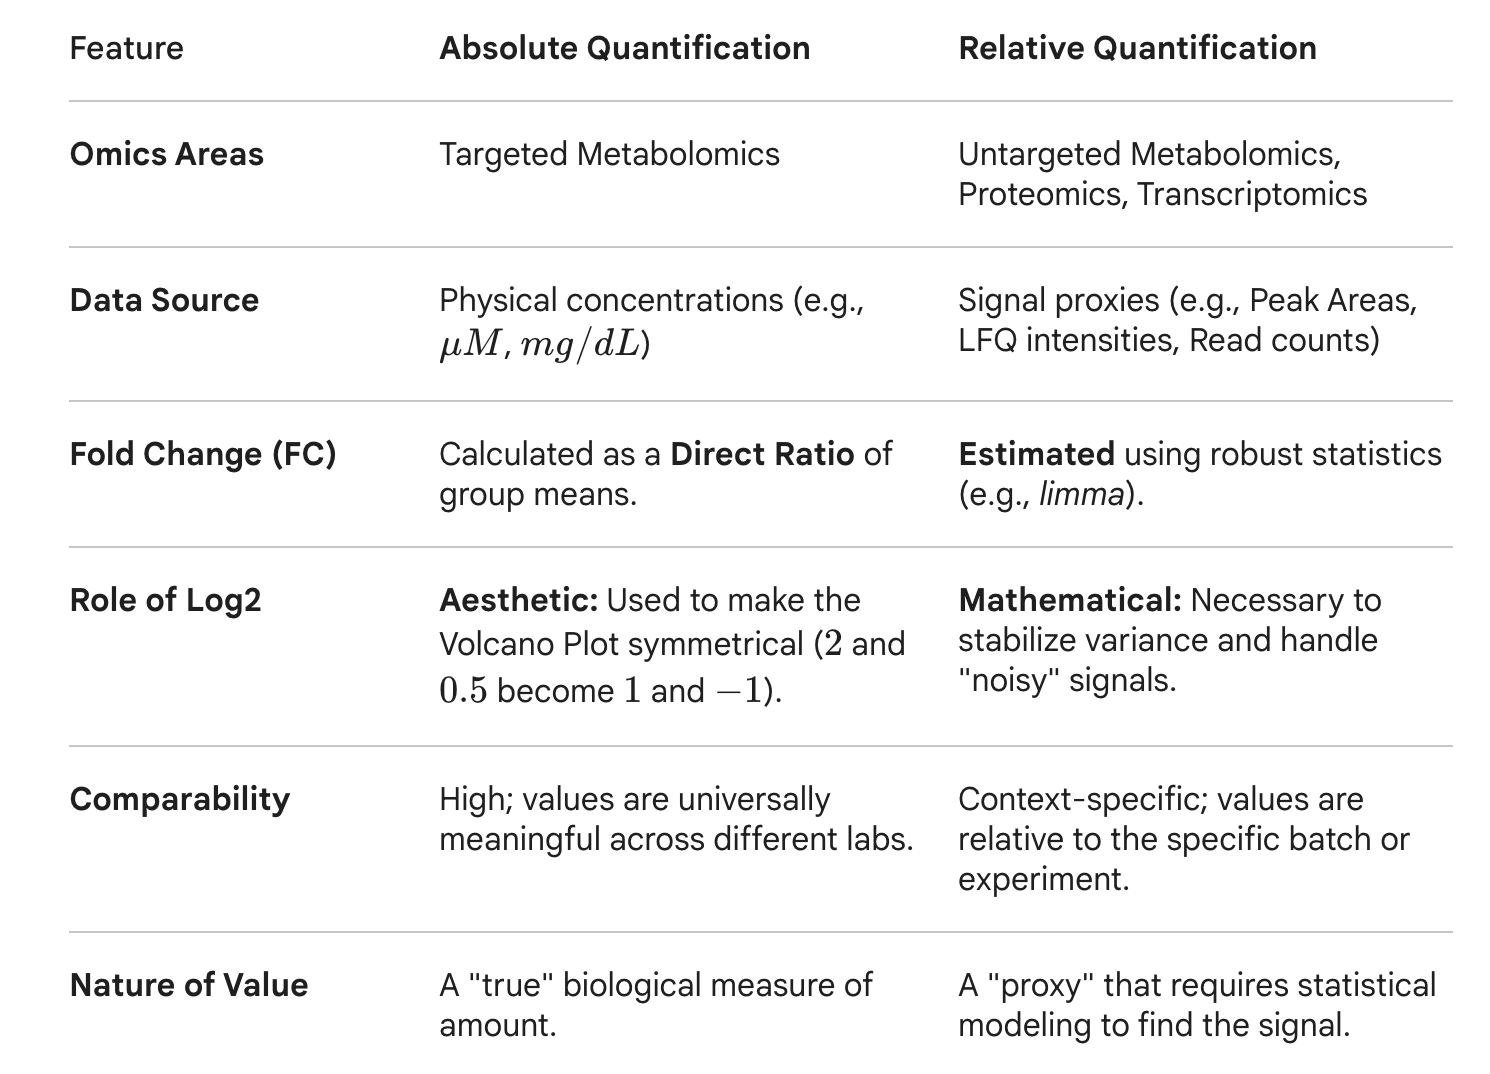
MetaboAnalyst was initially developed for targeted metabolomics data (i.e. absolute metabolite concentrations). The values are clinically meaningful and are universially comparable. For instance, we know the normal range of metabolite concentrations in human blood. The fold change is simply the ratios of two group means based on their concentration. Applying log2 is mainly aesthetic (i.e. 2 fold increase and 2 fold decrease are symmtrical ) so the volcano plot looks like volcano shape …
-
For other areas (including untargeted metabolomics) - the abundance values are proxies (i.e. peak areas, counts, intensities, cpms) and instrument- and data- specific. When sample size is small, the mean estimation are also very variable and unstable. Log transformation isn’t just for the plot – it’s for mean-variance stabilization. For instance, limma is often used to estimate fold change which is superior because it uses “empirical Bayes” to borrow information across all features.
I hope you see the differences. Below is a summary table (done by Gemini). Giving the questions, we intend to provide both options for MetaboAnalyst FC in the next update.