Hi!
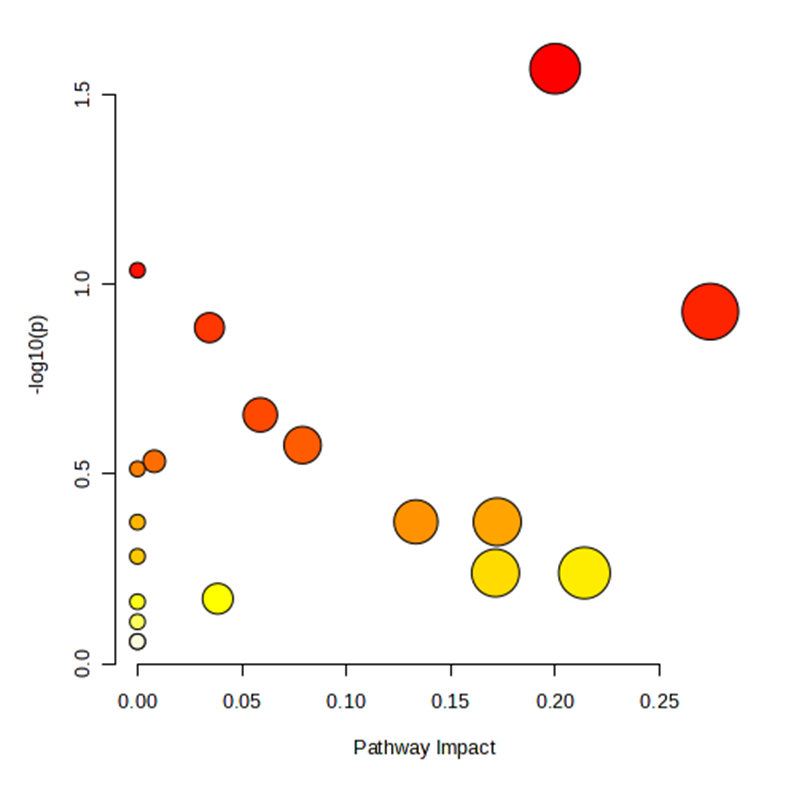
How can add a legend to the plot generated in the pathway analysis? This is an essential for publication.
(one needs a scale for the pathway impact indicated by the size of the circles, and a scale for the p-value indicated by the yellow-to-red color gradient).
Thank you!