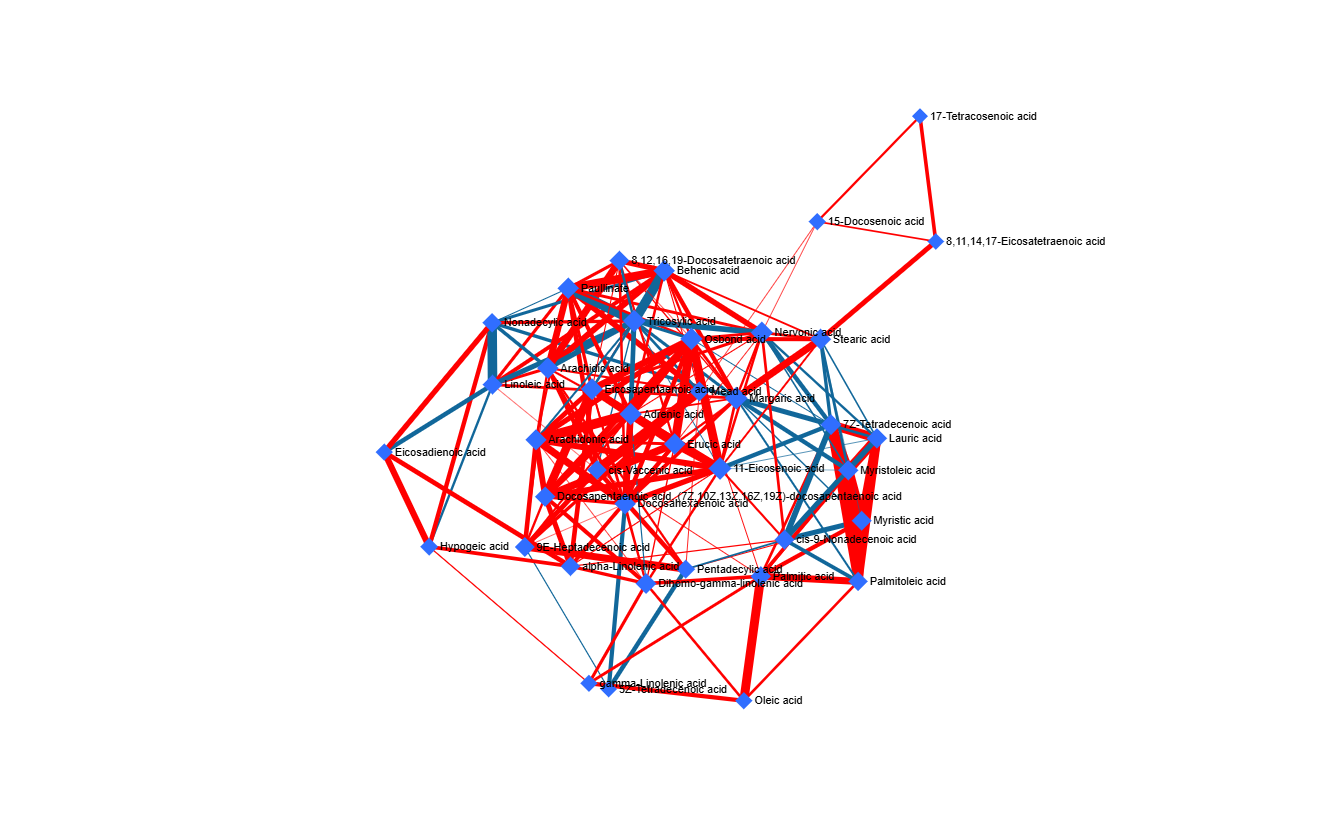
Hi everyone, question about interpretation. This is lipidomics, two groups, control and an exposure group. Can I assume that the red lines (positive correlations and higher significance with thicker connecting lines) would indicate that a pathway has been upregulated in the exposed group and, vice versa, with the blue connections that pathway is also downregulated?