Greetings,
I’m using functional analysis to do the LC-MS data analysis.
I’ve read all the tutorials provided on https://www.metaboanalyst.ca/, and browsed the relevant topics in the User Forum, but I still have some questions. I would appreciate your advice on the following questions.
- How to set the default p-value cutoff?
I’m a little confused about this statement, p-value cutoff (default top 10% peaks).
In the web version of the functional analysis module, is the p-value cutoff (default top 10% peaks) set based on the p-value of the top 10% of the smallest features in the data? Or do I not need to fill it in, and the software will automatically apply the p-value of the top 10% of the smallest features in the data?
-
The table output from the mummichog analysis consists of three kinds of p-value, the raw p-values (Hypergeometric), and the p-value modeled on user data using a Gamma distribution. But I want to know the which p-value it is used to calculate the log10(p-value) showed in the pathway summary plot?
-
How to use enrichment factor to assess the importance of a pathway? Is that a higher enrichment factor indicates a greater degree of enrichment for a particular pathway? Is the interpreter of enrichment factor greater than 1 or less than 1 similar to enrichment score?
I found the description about enrichment score in the GESA publication (C.A. Tilford, N.O. Siemers, Gene set enrichment analysis, Methods in molecular biology (Clifton, N.J.), 563 (2009) 99-121), but enrichment factor is not mentioned. Here is my personal understanding of the enrichment score (ES) and enrichment factor, but I’m not sure whether they are correct.
The enrichment score (ES) is the maximum deviation from zero encountered during that walk. The ES reflects the degree to which the genes in a gene set are overrepresented at the top or bottom of the entire ranked list of genes. A set that is not enriched will have its genes spread more or less uniformly through the ranked list. An enriched set, on the other hand, will have a larger portion of its genes at one or the other end of the ranked list. The extent of enrichment is captured mathematically as the ES statistic. An enrichment of exactly 1 indicates that the selection has the same proportion of class members as the reference set. Enrichment values greater than 1 indicate that the selection is enriched for the classifier, while values less than 1 indicate depletion. While helpful, the enrichment alone does not provide any indication of how unusual such an enrichment may be. Very large enrichment values are generally not significant when dealing with very small values of N or n, and similarly a modest enrichment can be very significant when N or n is large.
The enrichment factor is a measure used in enrichment analysis to assess the enrichment of specific metabolite sets or pathways. It represents the fold enrichment of a metabolite set or pathway compared to a background or reference set. The enrichment factor is calculated by comparing the proportion of metabolites within the metabolite set to the proportion of metabolites in the background set. Enrichment Factor > 1: If the enrichment factor is greater than 1, it indicates that the metabolite set or pathway is overrepresented or enriched compared to the background. In other words, there is a higher proportion of metabolites within the metabolite set than would be expected by chance. Enrichment Factor = 1: If the enrichment factor is equal to 1, it suggests that the metabolite set or pathway is not enriched or overrepresented. The proportion of metabolites within the metabolite set is similar to the proportion in the background. Enrichment Factor < 1: If the enrichment factor is less than 1, it implies that the metabolite set or pathway is underrepresented or depleted compared to the background. The proportion of metabolites within the metabolite set is lower than expected by chance.
-
Is the selection of candidate pathways for subsequent biological validation based primarily on p-value rank? or we need to take the enrichment factor into account? My point is that the selection of candidate pathways should be based on a combination of statistical significance (p-value), enrichment factor and biological relevance together. However, I did not get the exact value of the enrichment factor in the output.
-
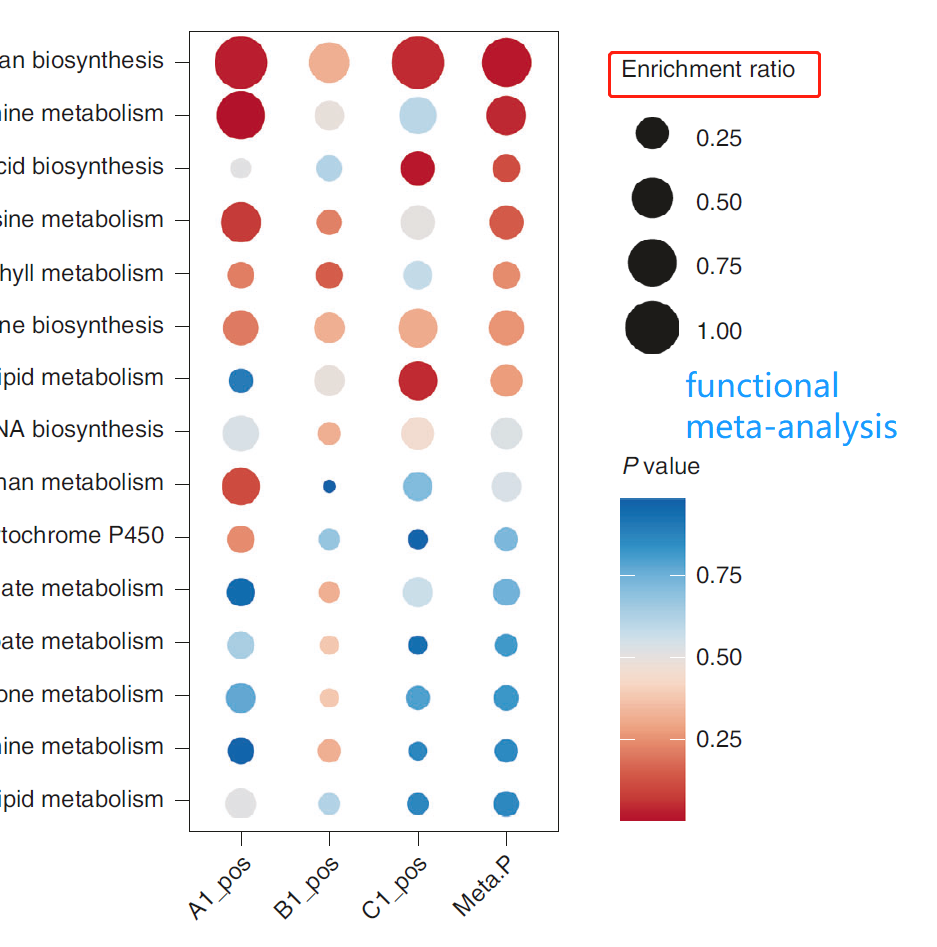
The result of ‘Functional Meta-analysis’ is the bubble plot. The bubble sizes are correlated with their enrichment ratios. What’s the difference between enrichment factor and ratio? How we select candidate pathways for subsequent biological validation according to the bubble plot?
Have a nice day,
Suyun