The meta-data overview page gives a chance to understand relationships between different meta-data variables. This is an important part of downstream analyses - if some metadata are highly correlated, it can impact the stability of coefficient estimation during linear modeling, and can influence your choice of which variables to include in the final model.
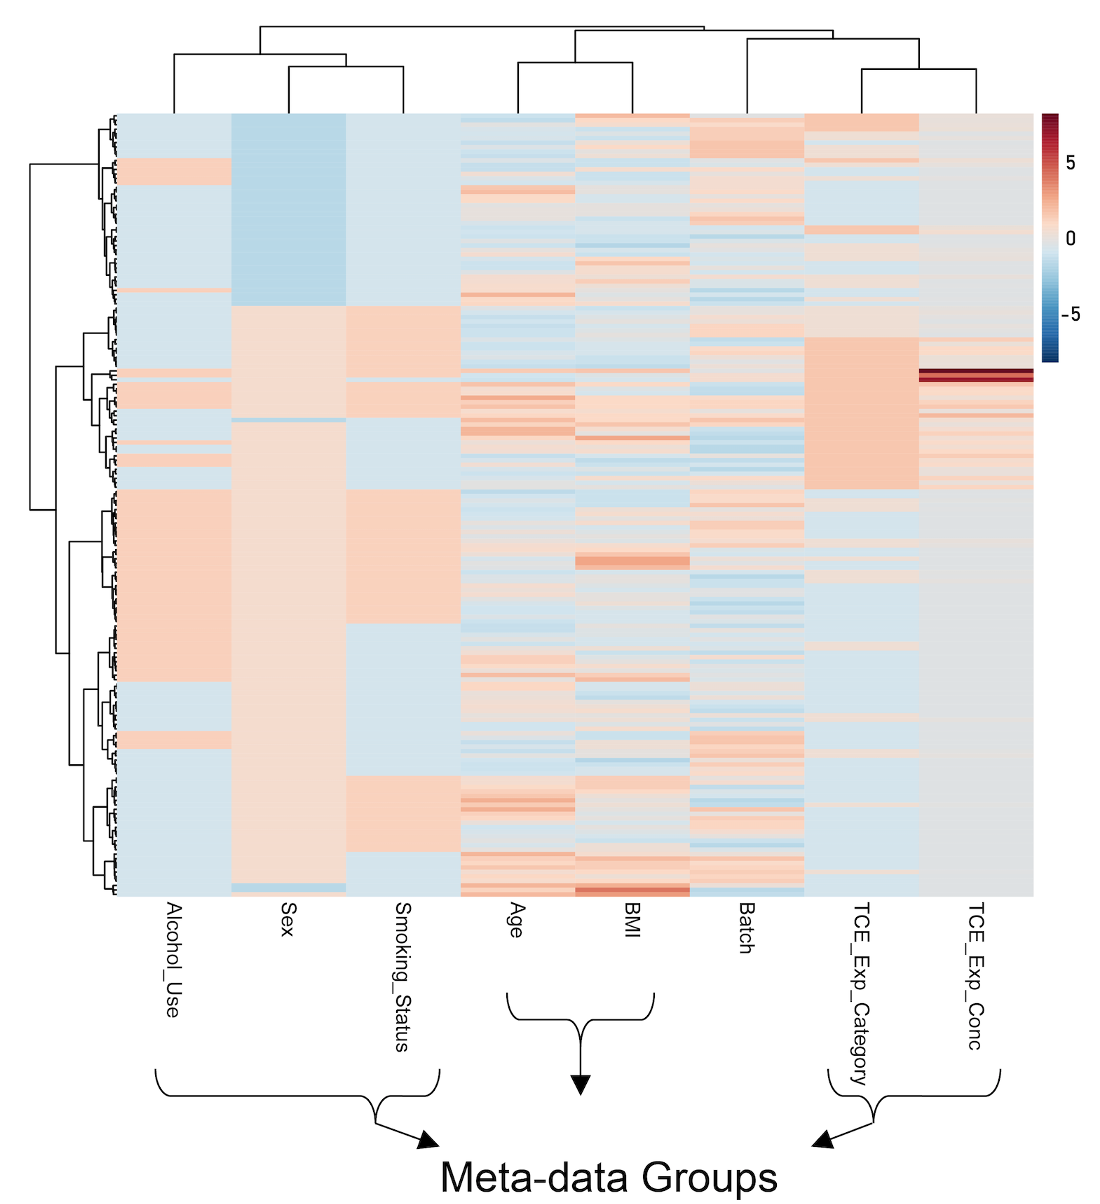
The “Meta-data Heatmap” and the “Correlation Heatmap” both show relationships between metadata variables. The Meta-data Heatmap (see a Fig. below) shows actual meta-data values and allows more flexible clustering options while the Correlation Heatmap summarizes relationships with pairwise correlation coefficients.