The reference concentrations SSP were mainly collected from literature based on HMDB. In most cases, the measured concentration should be comparable to the literature reported values as shown below. However, users should keep in mind that these concentrations were measured based on heterogeneous analytical platforms. Therefore, it is more suitable to compare with concentrations measured by the similar technologies. It is advisable to refer to the original literature (provided by SSP) if very extreme values are encountered.
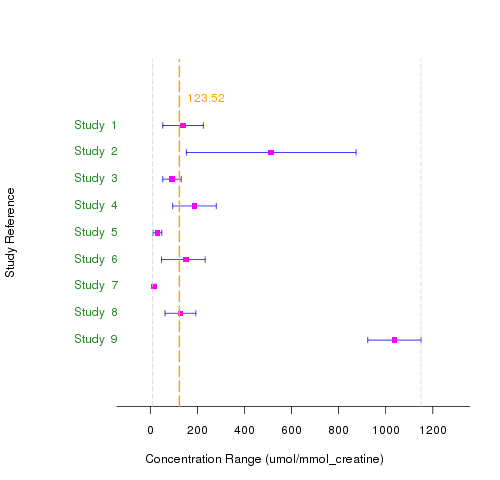
The image below shows the comparisons of the measured urinary Glycine concentration (indicated by a dotted yellow line) to literature reported concentration values. The magenta squares indicate the mean concentration values, and the blue lines indicate the reported ranges. In some cases, 95% confidence intervals are used (two standard deviations from the mean) if no ranges were provided in the original report. Note the link to the original reference of each study will be provided in a table under each plot during analysis.