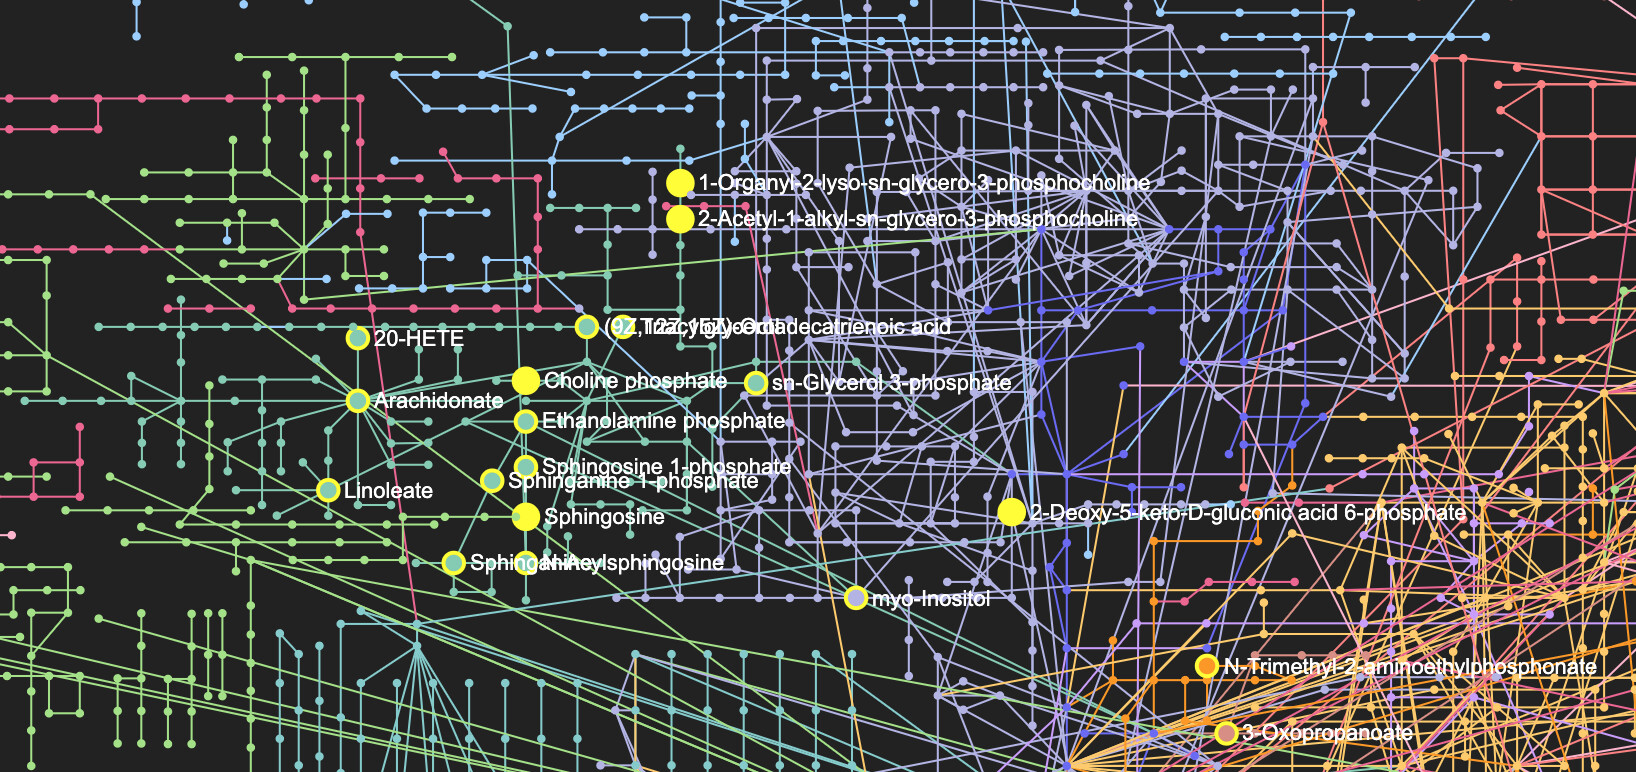
The metabolic network visualization is based on the KEGG global metabolic network and has been manually curated. It aims to provide a global metabolic context for the significantly enriched mapped metabolites, as well as provide an in-house option for visual exploration of the results from the untargeted pathway analysis.
Users can click on a pathway name from the left panel to view all matched compounds within this network (see the Fig. below). Empty circles indicate the compounds are detected but insignificant; Solid circles indicate the compounds are detected and significant. Double click on those matched node will show all peaks assigned to this compounds (i.e. empirical evidence)
Users have the option to colour each specific pathway to their own preference, change the background colour, switch the view style, and download the image as a PNG or SVG file.