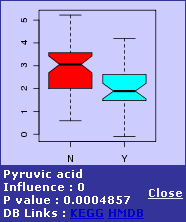
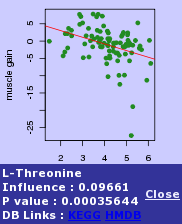
The “compound view” is generated from univariate analysis for the matched compound. They show the concentration distributions of the corresponding compound with regard to the phenotype labels.
Two examples of “compound view” are shown below:
- The box plot image on the left shows the result with categorical (binary or multi-group) phenotype labels (t-tests, ANOVA);
- The scatter plot image on the right shows the result with continuous phenotype labels ( linear regression).