Hi team,
Hope you are well and thank you for initiating the forum.
I would like to ask few questions regarding ANOVA:
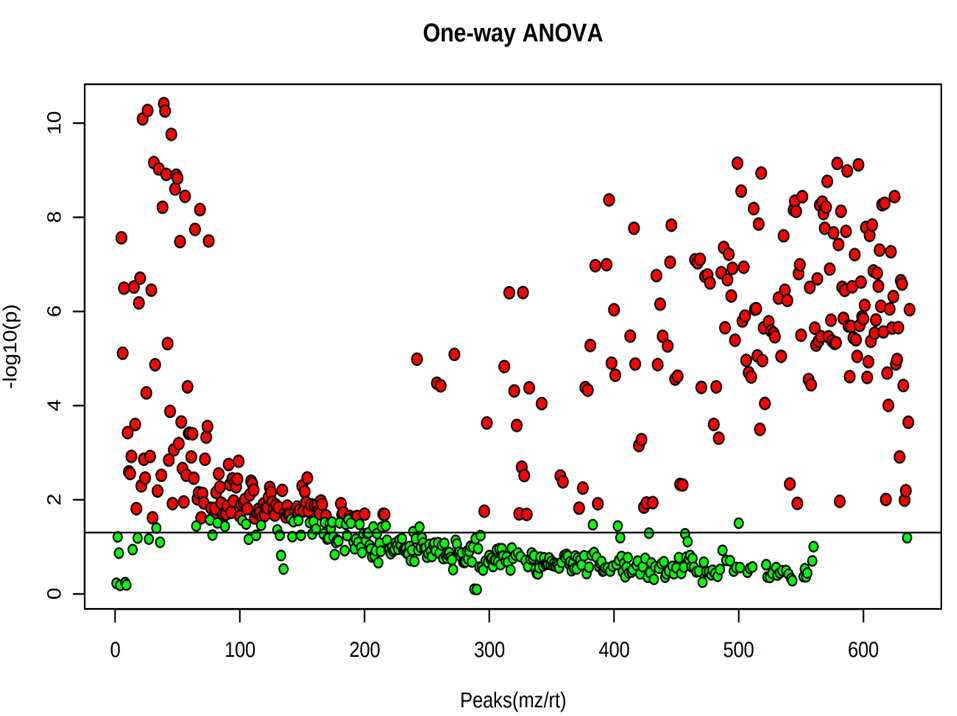
- When using the FDR of 0.05 in ANOVA analysis, my understanding is that any feature lies above the cut-off indicating that the feature is significant at least one of the groups. On the one hand, some features seem to be appeared above the cut-off, yet they were insignificant shown as green. How did the green features pass the threshold?
- For some reason, the figure did not show up after uploading here.
- Y axis corresponds to -log10(raw p value). If FDR cut-off is applied to data, does it mean Y axis will be corresponding to the adjusted p value, which is the FDR value?
- Few selected features shown in the boxplot were displayed in both negative to positive scale like 2 groups are in positive scale while 1 group is in negative scale. How does MetaboAnalyst calculate it?
ANOVA settings: 1) FDR cut-off:0.05, 2) post-hoc analysis: Fisher’s LSD
Thank you for the clarification and help.