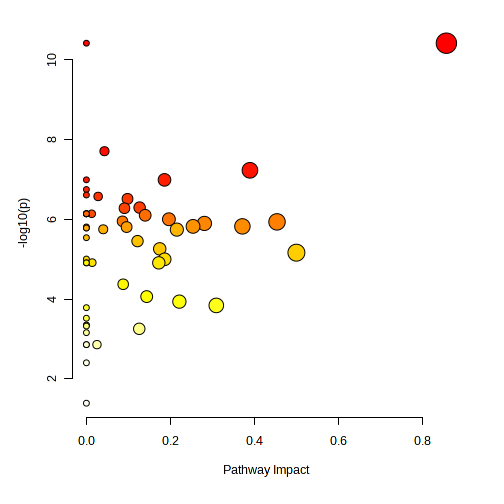
I can hover my mouse over each dot on the graph to get the pathway information - but is there a way to add data labels to this graph? Seems very simple, but I can’t find the option to do this.
MetaboAnalyst is designed for online interactive exploration - every data point is labelled and you can see it with mouse over. These features cannot be captured by PDF, labeling all of them simple won’t be useful (i.e. not readable).
Note with the empty / unlabeled graph, you can annotate any pathways of interest directly using PointPoint or other graph editing tools.