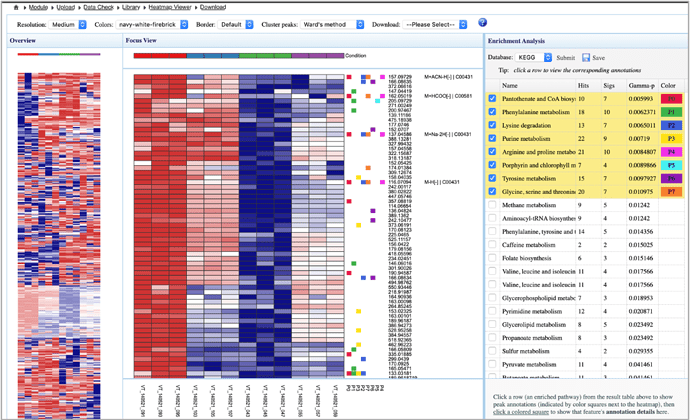
The peak intensity table allows users to perform more flexible data analysis of their untargeted metabolomics data, including
- Flexible data processing and normalization using various options within MetaboAnalyst (like in the Statistical Analysis module) to create the peak list, and then the mummichog or GSEA based functional enrichment analysis
- Visually perform enrichment analysis on any patterns of interest (for instance, co-regulated peak groups, not just significant peaks) through an interactive heatmap.
Steps:
- Drag-select a pattern from the left panel (Overview) to the center panel (Focus View);
- Perform enrichment analysis on the patterns displayed within the Focus View;
- Click an enriched pathway to examine their matched annotations beside their patterns
Live Demo:
You can watch this video to get how does the interactive heatmap work.
