Dear MetaboAnalyst team,
When I submitted a data matrix to PLS-DA using MetaboAnalyst, I got the following VIP plot.
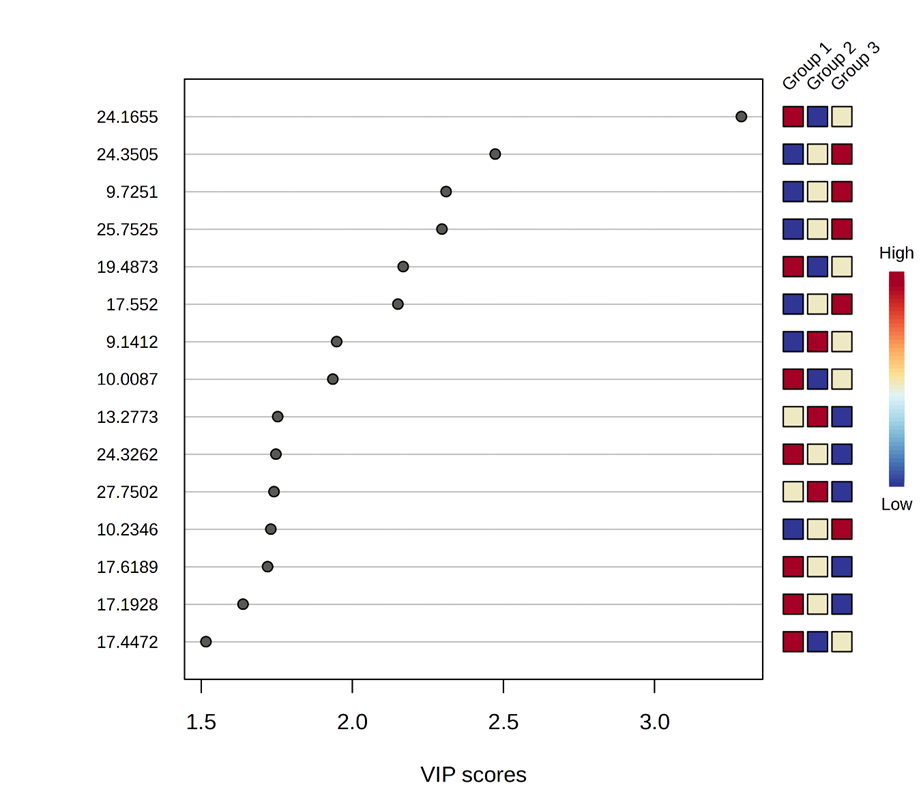
According to the relative concentrations showed in the graph, for the feature with the highest VIP value (the one named “24.1655”), Group 1 should show the highest concentration for this compound, Group 2 the lowest and Group 3 should be in between them. Nevertheless, I have noticed a different behavior in the data matrix. When I calculate the average concentration considering the six samples of each group, Group 1 shows the highest concentration, followed by Group 2 and then by Group 3 (see image below).
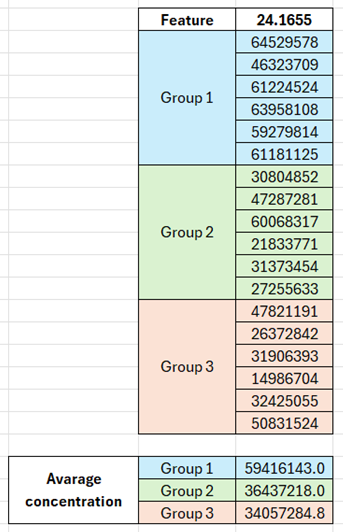
This made me wonder, how does MetaboAnalyst determines the relative concentration of each group?