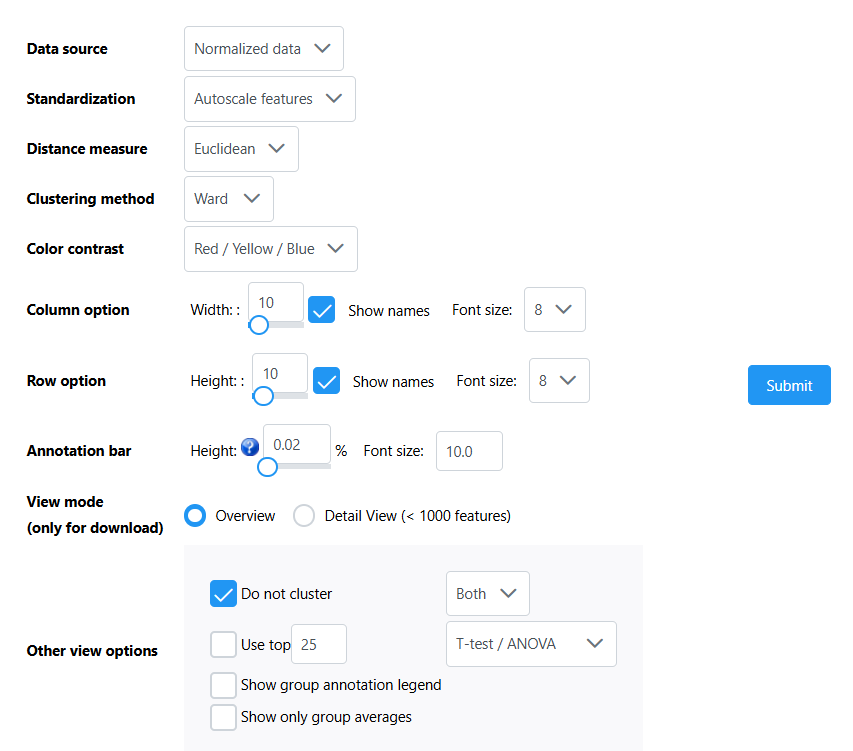
Hello! I am making a heat map using metabolanalyst, and I am curious about how the heat map quantification is conducted. Here are the parameters that I’m using:
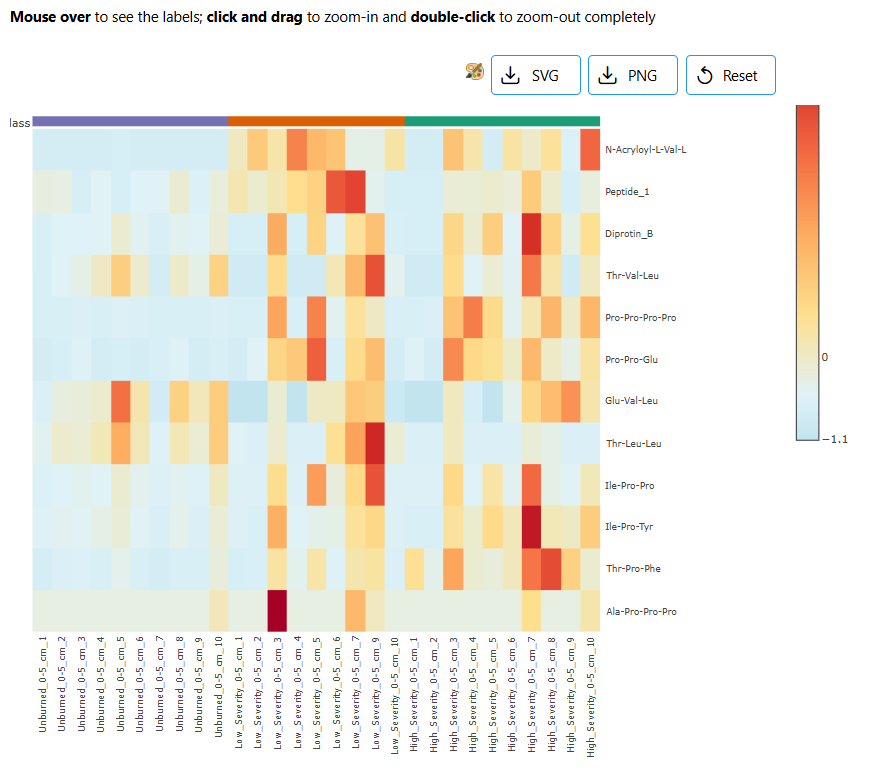
And here is an example heatmap that I’ve generated with those parameters:
How are the quantified values in the cells calculated based on “autoscale features?” For example, the cell for “Low_Severity_0-5_cm_3” and “Ala-Pro-Pro-Pro” has a value of 4.85. How is that value calculated? In other words, how does the “autoscale features” calculation work?
This was already answered in the other post. The heatmap values are not interpretable in general (the exception is log transformation, which is relatively simple). In your case - quantile normalization followed by autoscaling, which will be very difficult to give explanation - as both methods use some global summary statistics.
But how the values are calculated? It is exactly as you described - quantile normalization followed by autoscaling for features (i.e. z-scores for each feature). You can see the R commands (in “R Command History”) and the source code (in the MetaboAnalystR package). If you still would like to know more