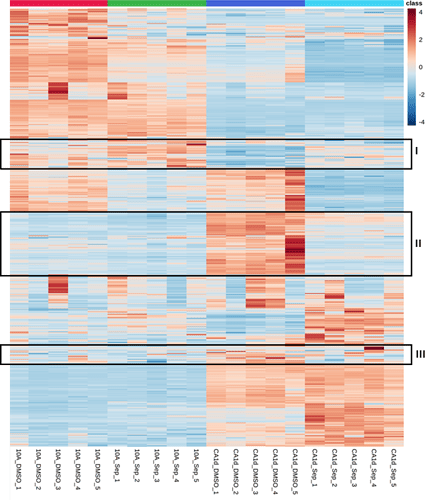
Please see the attached picture. I found three metabolite clusters (I, II, and III of my interest) after creating a heatmap for four treatment groups (n=5). I want to know how to select only the clustered metabolites for further enrichment analysis.
Hi,
Thank you for asking this question. In general, enrichment analysis is not available in the “Statistical Analysis” module as feature IDs need to be standardized first.
-
If your input data type is LC-MS peak intensity table (i.e. untargeted metabolomics), you can indeed perform direct selection on heatmap clusters as you described. Choose the “Functional Analysis” module. In the Visual Analytics method (Library View page), select “Heatmaps” (see below). You should be able to select clusters on the resulting heatmaps.

-
If your input data type is compound concentration table (i.e. targeted metabolomics), a similar function is available in the “Pathway Analysis” module.

-
For “Enrichment Analysis” module, the support is not available yet (the feature is in our to-do list). At the moment, you can achieve this using two modules:
- In the “Statistical Analysis” module, use the “Heatmaps” function to identify clusters (you already did this step). Here use the “Detail view” option and record those compound names in the clusters of interest;
- Upload those compound names to the “Enrichment Analysis” module for enrichment analysis
