Within our data on lipidomics from LC/MS, we have two groups (Control, Test) that we need to label them and also 5 subgroups on “Time” (Time 1, Time 2, Time 3, Time 4, Time 5).
Could you please provide us some guidance on how we need to format the structure of the CSV file in order to compare, for example, those samples that belong to “Control-Time 1” vs “Test-Time 1”? I have provided a copy of our data to Prof. Xia.
Thank you very much.
1 Like
There are two modules for performing statistical analysis of a metabolite table: “Statistical Analysis [one factor]” and “Statistical Analysis [metadata table]”.
In either case, you can see the appropriate data format by clicking the module name, scrolling down to the example datasets, and then clicking the linked files:
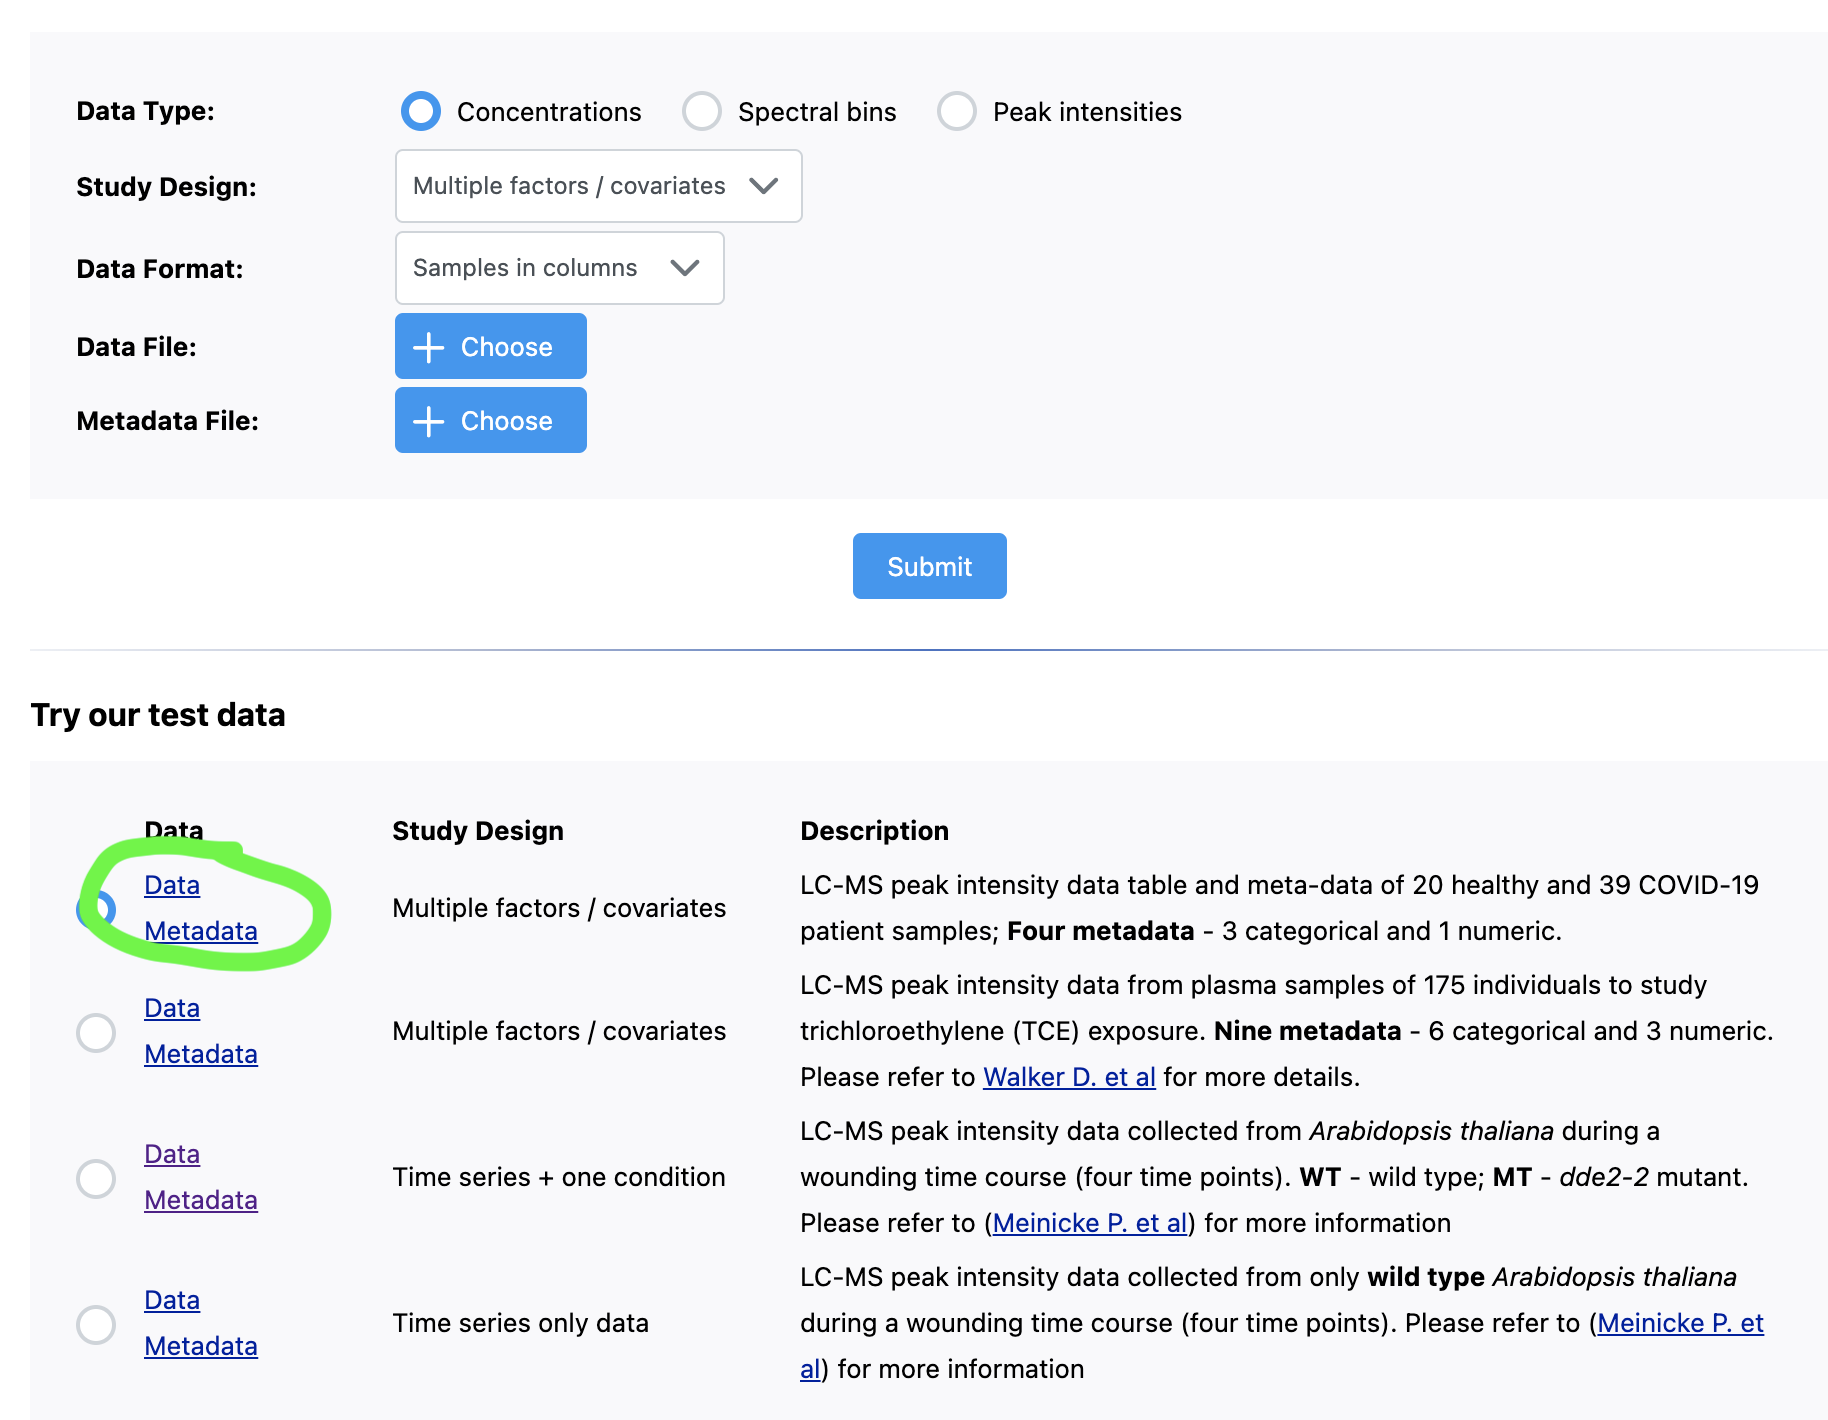
In your case, if you have multiple metadata types, you likely want to use the “Statistical Analysis [metadata table]” module. There is an option specifically for datasets with one phenotype, a time series, and subject ID, however the underlaying R package requires a balanced design (same # replicates in each experimental group).
The “Multiple factors/covariates” experimental design is the most flexible, however there are still requirements surrounding the minimum number of replicates.